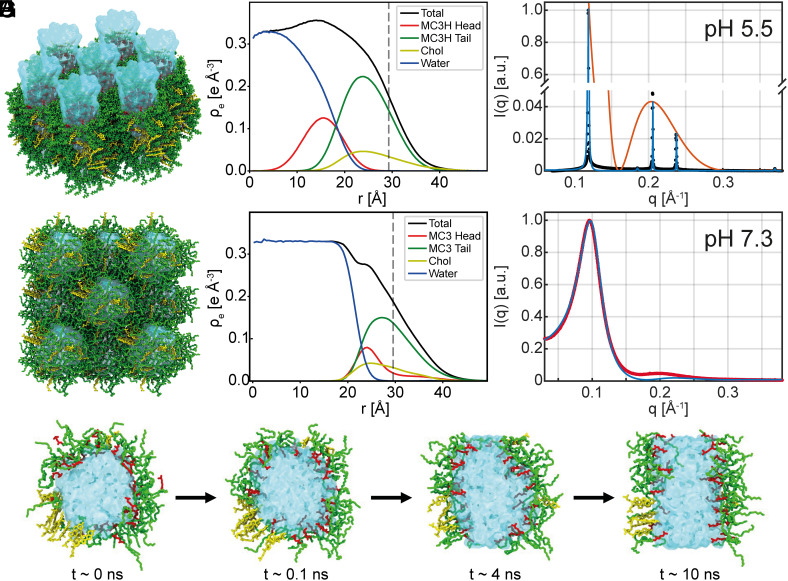
Fig. 3.
MD simulations and electron density profiles of inverse phases for MC3. (A) Snapshot from an all-atom MD simulation of the phase for fully charged MC3 and chol. Water is shown in blue; cationic headgroup and tail of MC3 are shown in red and green, respectively. Chol is shown in yellow. (B) corresponding radial electron density profile for the individual components of a single cylindrical micelle from MD simulations. The black line indicates the total electron density; the vertical dash line is the half nearest neighbor distance (C) SAXS data are plotted as black dots, the fitted SAXS profile in blue and the form factor obtained from MD in orange. (D) Simulation of tightly packed inverse micelles for uncharged MC3 and (E) electron density profile. (F) Scattering of phase in red fitted in blue with the structure factor for densely packed spheres multiplied by the form factor obtained from MD. (G) Time series showing a cross-sectional view of an inverse-spherical to inverse-cylindrical micellar transition after charging the MC3 ionizable group at time t = 0. First, the MC3 headgroups swing into the water phase. Subsequently, a slower rearrangement from an inverse spherical to inverse cylindrical micelle takes place.

