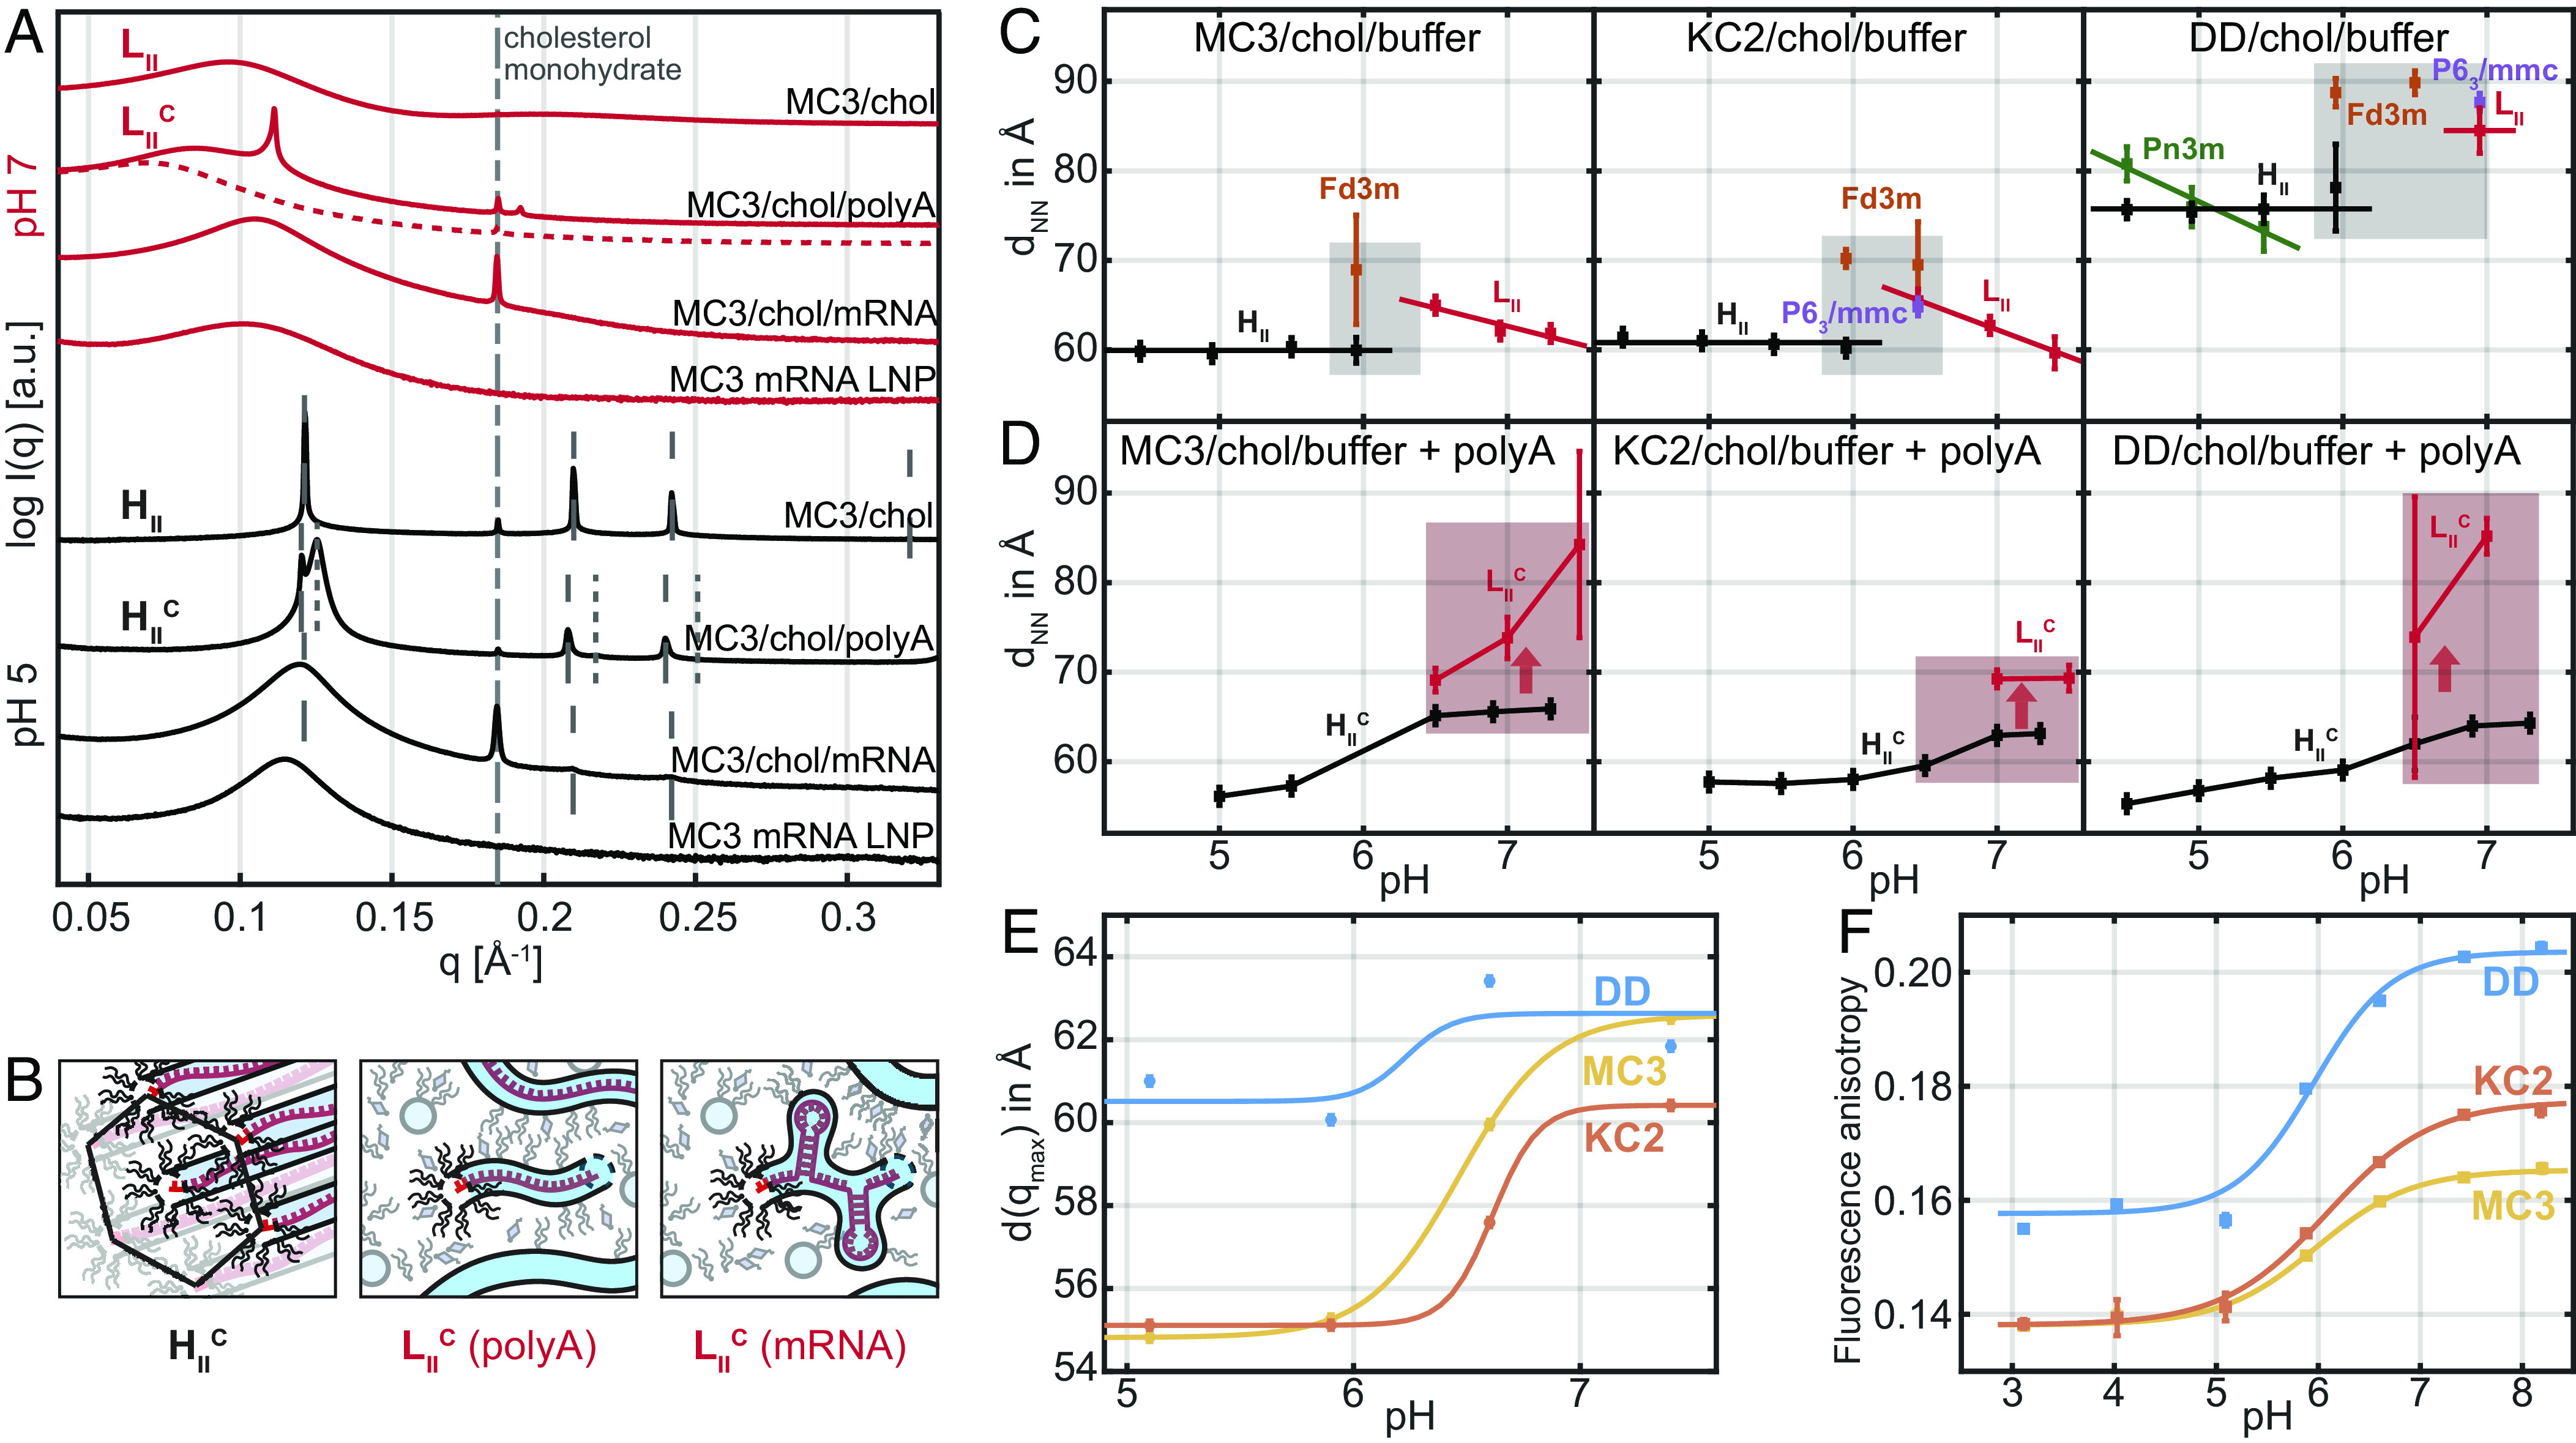
Fig. 4.

Scattering signature and pH-induced transitions in CIL bulk vs. LNP core phase. (A) SAXS scattering at pH 7 (red curves) of MC3/chol/water bulk phase, MC3/chol/water/polyA bulk phase, MC3/chol/water/mRNA bulk phase, and mRNA LNPs and corresponding SAXS data at pH 5 (black curves). The MC3/chol/water/polyA preparation at pH 7 showed time dependence with the peak dissolving over weeks. We denote the dashed line as micellar isotropic phase. The mRNA filled bulk phases and LNPs exhibit less long-range order due to mRNA secondary structure. (B) Schematic drawing of the polyA condensed phase at pH 5, the polyA condensed (polyA) phase at pH 7, and an mRNA condensed (mRNA) phase. mRNA is assumed to retain secondary structure in a disordered —micellar-like lipidic phase. (C) Next nearest neighbor distances as a function of pH showing pH-induced transitions in CIL bulk phases and (D) in polyA containing complexed phases. The gray area indicates the transition region with cubic phases. The reddish area indicates metastability of . (E) pH-dependent correlation distance in LNPs derived from SAXS data (F) Fluorescence anisotropy of a hydrophobic probe (DPH) as a function of pH for MC3-, KC2-, and DD-LNPs, respectively. Increasing anisotropy indicates decreasing mobility. The critical pH values of half-maximum are 6.0, 6.1, and 6.0 for MC3-, KC2-, and DD, respectively. Data shown in (C and D) are measured at room temperature, (E and F) at 37 °C.
