
Fig. 2.
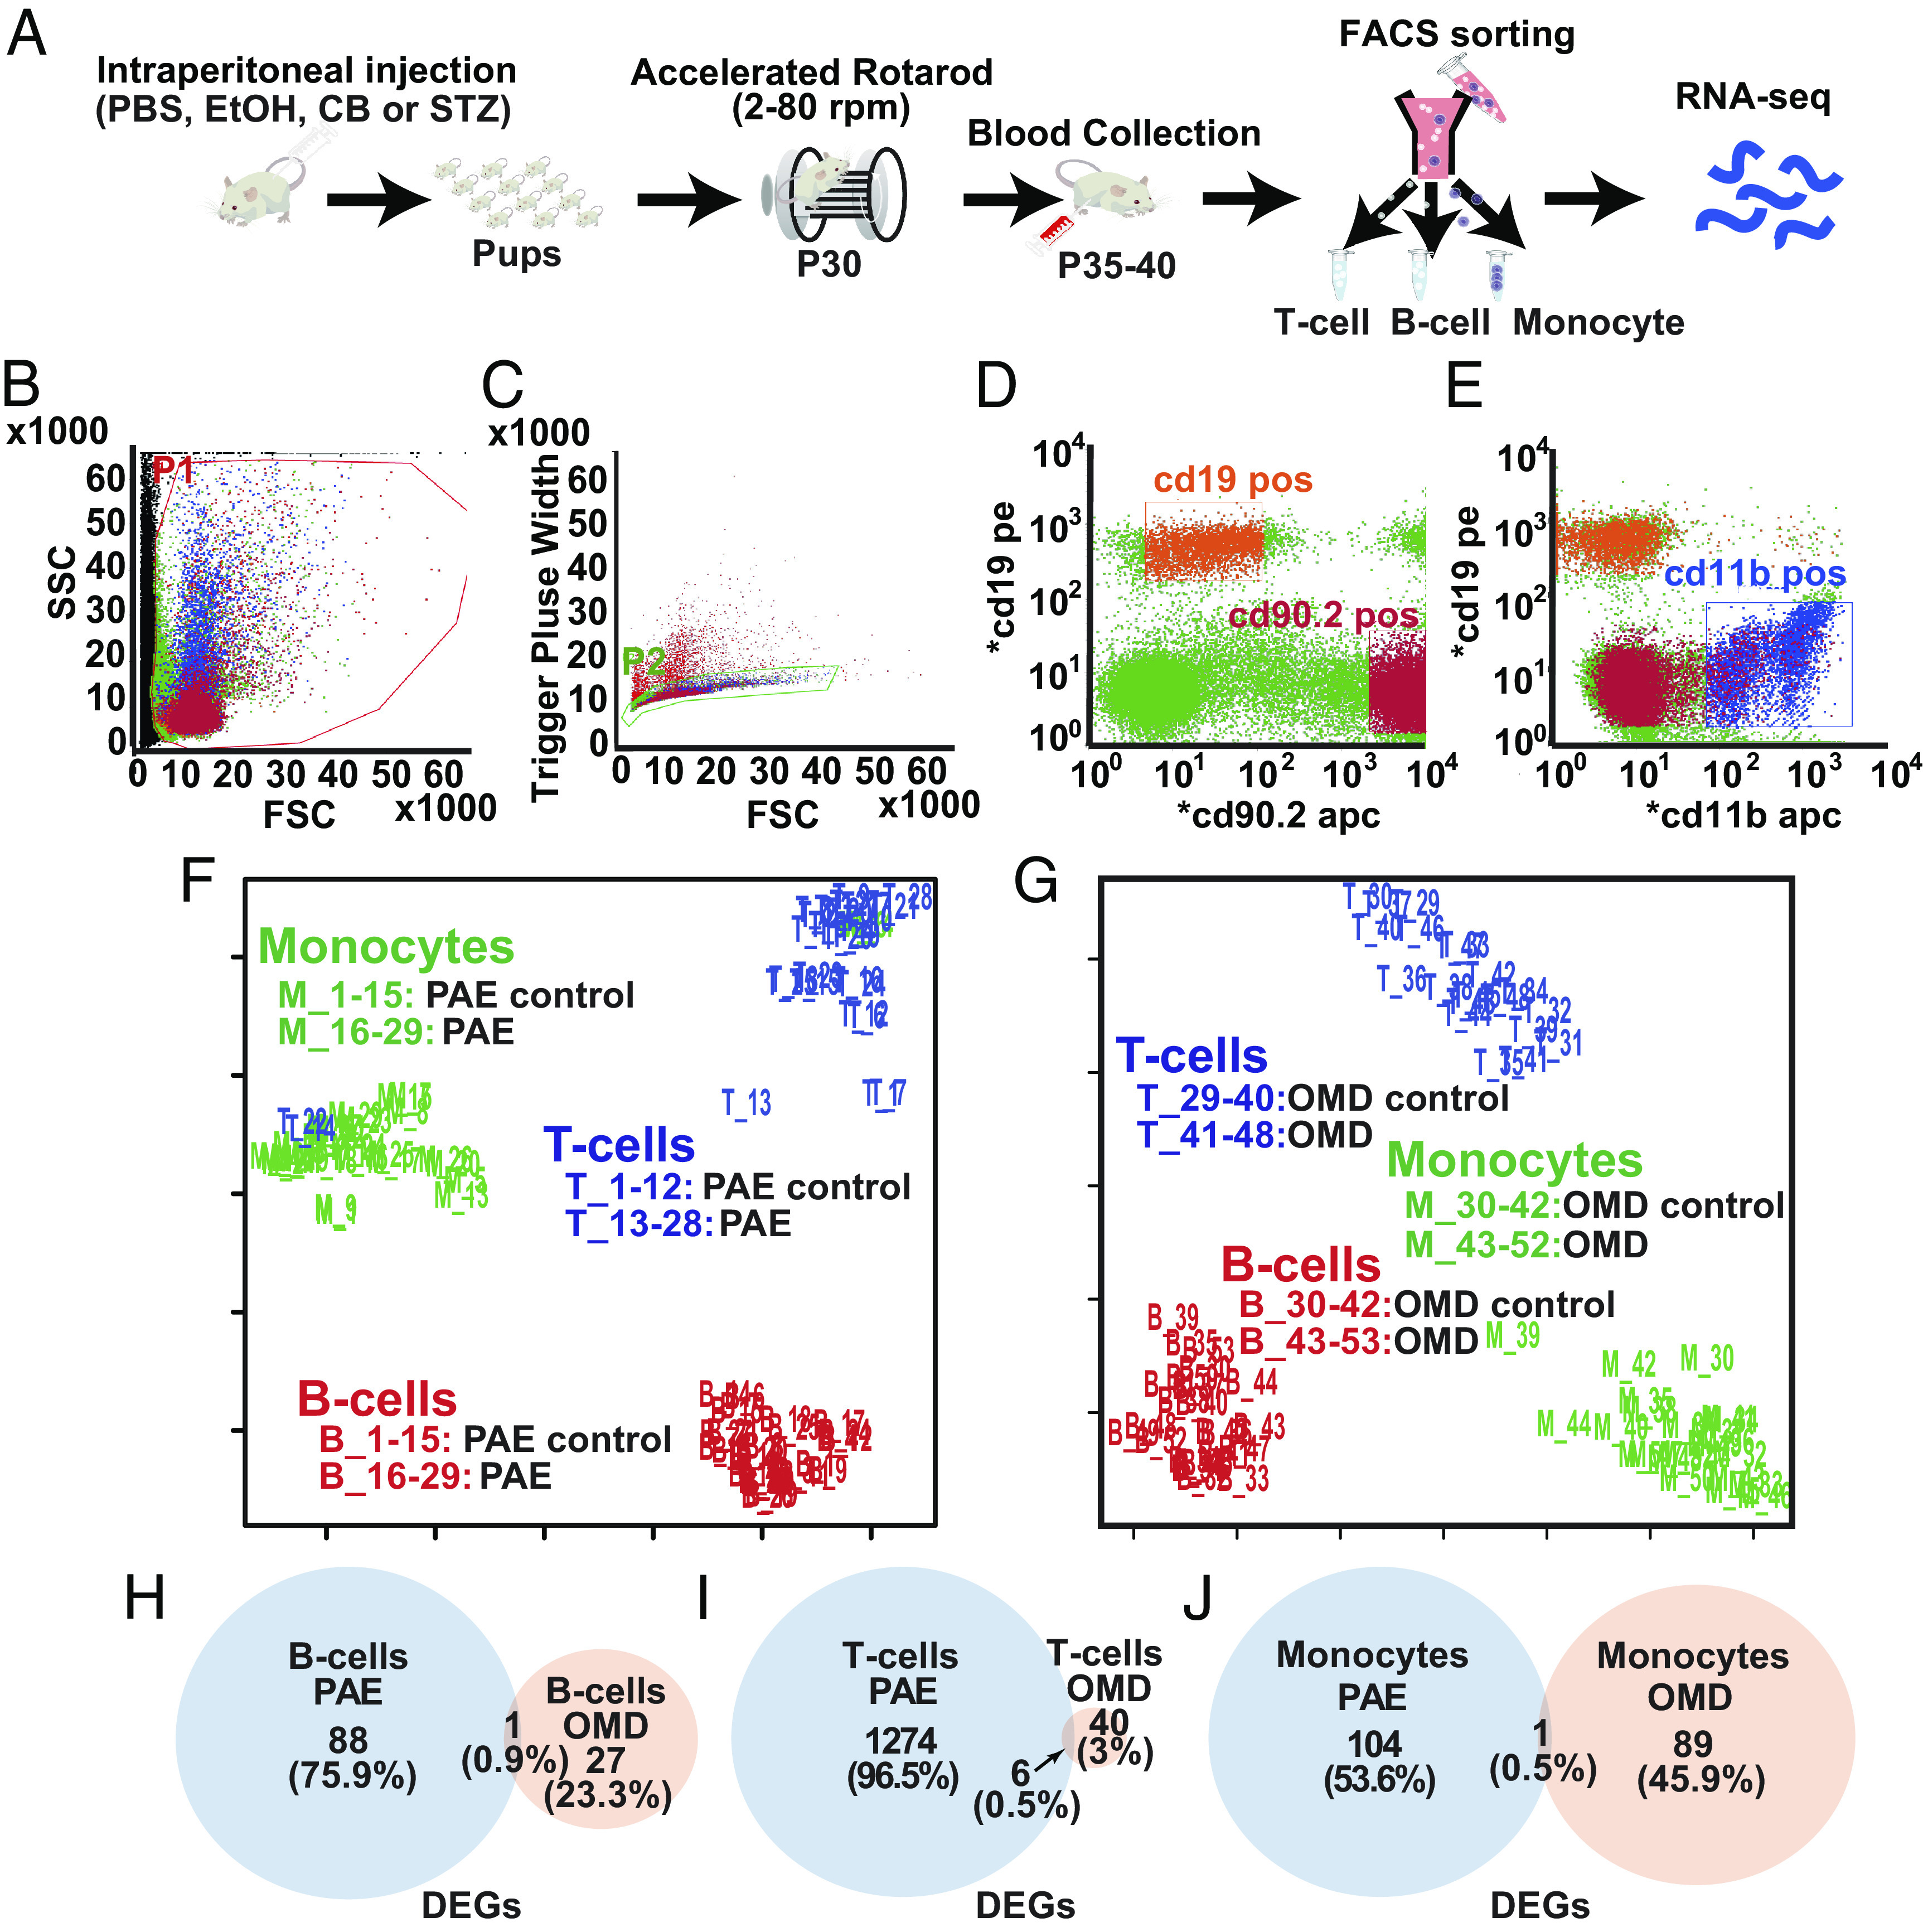
Number and proportion of common DEGs in PAE and OMD mice are minimal. (A) Blood was drawn from P35–40 mice after their accelerated rotarod test, and PBMCs—B cells, T cells, and monocytes—were FACS-sorted for RNA-sequencing. (B–E) PBMCs, labeled with surface antigen markers, were sequentially gated based on cell size [forward scatter (FSC) vs. side scatter] (B) and singlets (FSC vs. trigger pulse width) (C) followed by their sorting into B cells (D, CD19+/CD90.2−), monocytes (D, CD19−/CD90.2+) and T cells (E, CD11b+/CD19−). (F and G) MDS analysis of normalized RNA-seq count data from all samples show clustering of samples by cell type, in PAE (F) and OMD (G). (H–J) Venn diagrams show the number and proportion of unique and common significant DEGs in PAE and OMD, in comparison to their respective controls, in B cells (H), T cells (I), and monocytes (J). At least a twofold change in gene expression, per EdgeR analysis, was considered significant.