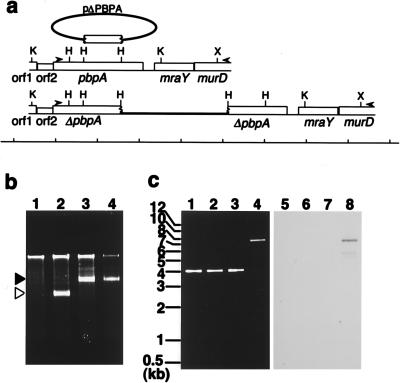
FIG. 4.
(a) Restriction maps of the genomic fragment around pbpA before and after integration of suicide plasmid pΔPBPA. The name of each ORF is indicated under the maps, and the size marker is indicated at the bottom. Short vertical lines in the size marker are 1 kb apart. Arrowheads show the locations of the primers used for PCR shown in panel c. Abbreviations of the restriction enzymes are as defined in the legend for Fig. 2. (b) Plasmid profiles of S. aureus clones. The plasmid fraction of each clone was analyzed by agarose gel electrophoresis. Solid and open triangles indicate pPBPA and pAW11, respectively. Lane 1, RN4220; lane 2, AW302; lane 3, AW303; lane 4, AW304. (c) PCR-amplified fragments separated by agarose gel electrophoresis (lanes 1 to 4) and Southern hybridization analysis (lanes 5 to 8) by using pAW9 as a probe. Lanes 1 and 5, RN4220; lanes 2 and 6, AW302; lanes 3 and 7, AW303; lane 4 and 8, AW304. The sizes of size markers are indicated at the left side of the panel.

