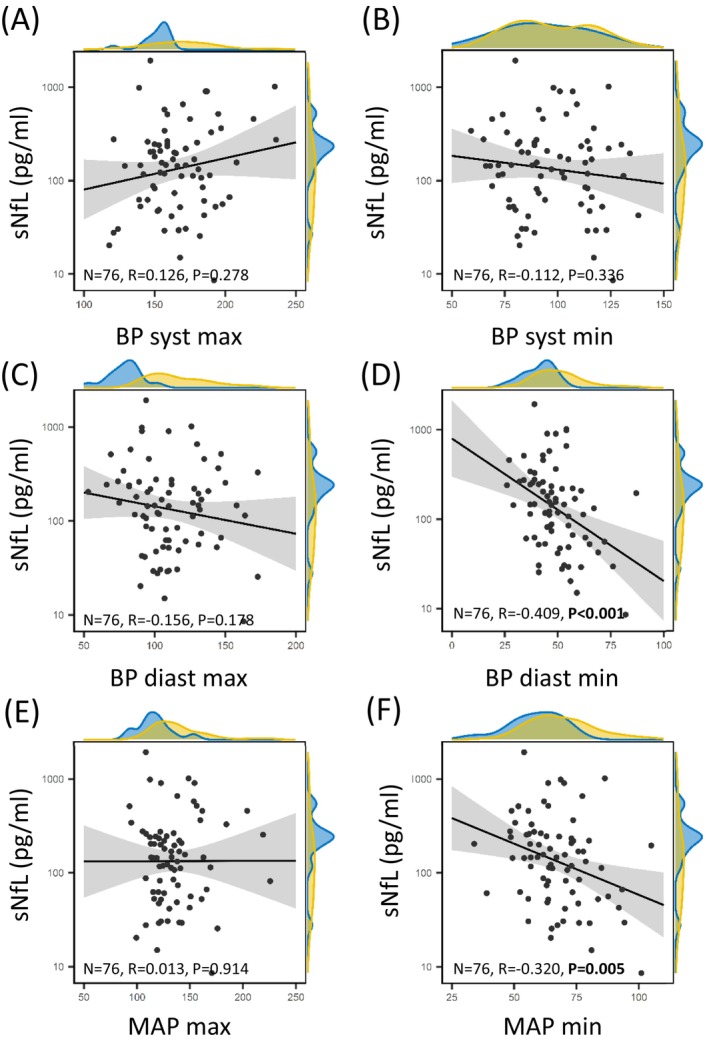
Figure 3.

Increased sNfL level inversely correlate with minimal MAP and minimal diastolic BP. Scatter‐Plot displaying the correlation between log sNfL and BP parameters. A density plot of sNfL and BP parameters is displayed at the margins highlighting “low‐BP” patients strictly achieving BP target ≤ 160/90 mmHg in blue and “high‐BP” patients (>160/90 mmHg) in yellow. BP, blood pressure; diast, diastolic; MAP, mean arterial pressure; max, maximum; min, minimum; sNfL, serum neurofilament light chain; syst, systolic.
