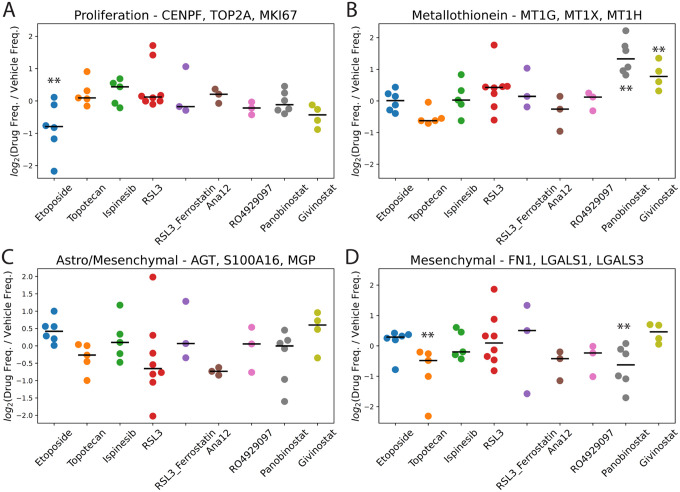
Figure 4.
Fold-changes in the frequencies of cells with high cell scores in drug-treated vs. vehicle control-treated slice cultures in the transformed glioma cell scHPF model for A) a proliferation factor; B) a metallothionein factor; C) an astrocyte/mesenchymal factor; and D) a mesenchymal factor. Here, each dot represents an individual patient (i.e. biological replicates). For each drug, ** indicates FDR<0.05 based on a linear mixed model.

