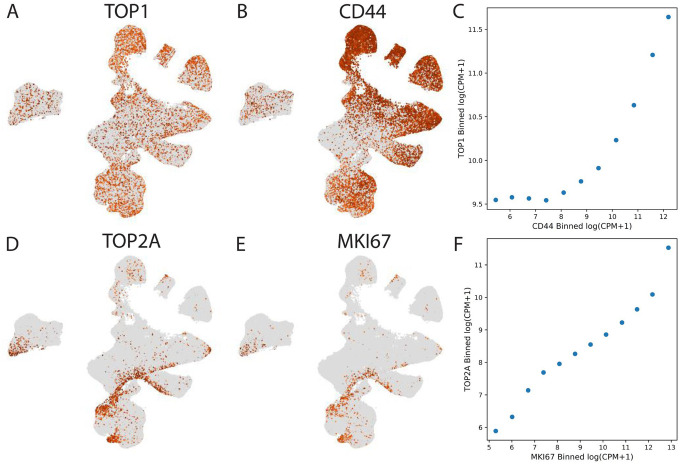
Figure 5.
A) UMAP embeddings of the cell score matrix for the consensus scHPF model of transformed glioma cells colored by log(CPM+1) expression of TOP1; B) same as A) but for CD44; C) correlation between binned expression of TOP1 and CD44; D) same as A) but for TOP2A; E) same as A) but for MKI67; F) same as C) but for TOP2A and MKI67.

