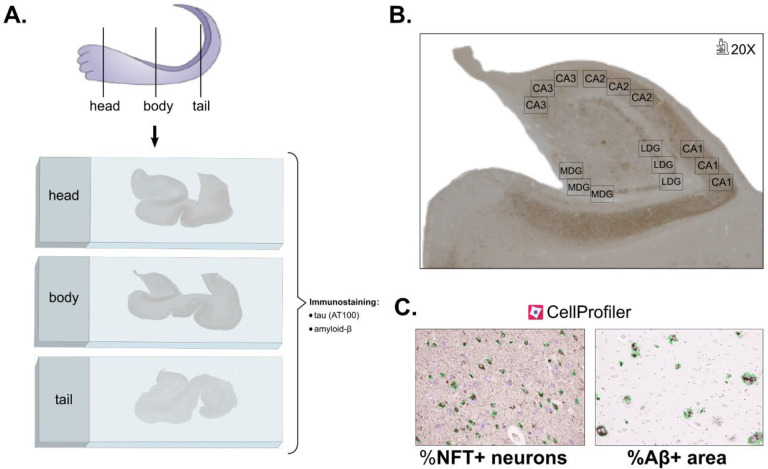
Figure 3. Summary of steps carried out for AD pathology quantification along the hippocampal longitudinal axis.
A. Three anatomical blocks were sectioned for histology: head, body, and tail of the hippocampus. Sections from each of these levels were stained with antibodies against tau (AT100) and Aβ. B. Three micrographs at 20X magnification were taken per subfield: CA1, CA2, CA3, medial (MDG) and lateral dentate gyrus (LDG). C. Each 20X micrograph from sections stained against tau or Aβ was quantified with CellProfiler 4.0.7, measuring the percentage of NFT+ neurons (outlined in green, versus NFT- neurons outlined in purple) or area covered by Aβ plaques (outlined in green), respectively. Aβ: amyloid-β; LDG: lateral dentate gyrus; MDG: medial dentate gyrus; NFT: neurofibrillary tangles.

