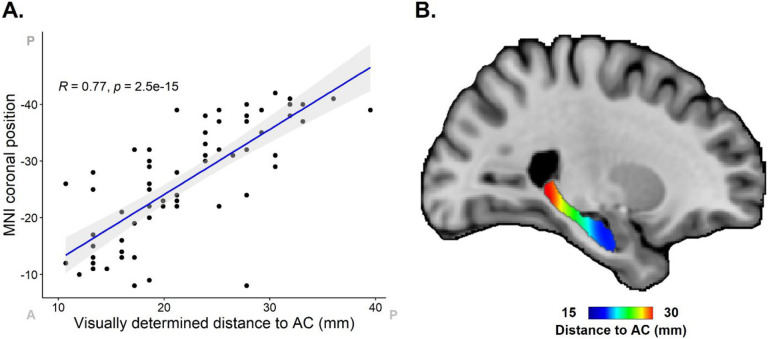
Figure 4. Comparison of histology localization with Path2MR with visually determined section positions.
Visual positions were determined by using a micro-atlas of the hippocampus51 as reference. A. Scatter plot and correlation between visually determined positions and coronal MNI position obtained from Path2MR. For each section, the slice with highest number of high-intensity voxels from the gaussian position distribution was used as its coronal MNI position. MNI coordinates have been reversed to ease visualization (from anterior to posterior). Anterior (A) and posterior (P) ends of x and y axes are indicated. Grey shaded region shows 95% confidence interval. B. Distribution map of distance to anterior commissure (AC) obtained with Path2MR, showing the shortest and largest distances in the hippocampal head and tail, respectively. AC: anterior commissure; MNI: Montreal Neurological Institute.

