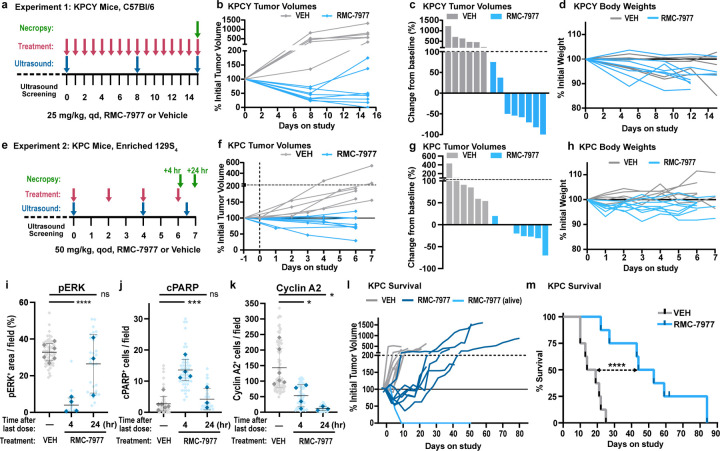
Fig 5. RMC-7977 inhibits tumor growth and extends survival in autochthonous models of PDAC.
(a) Schematic of KPCY mice (on C57Bl/6 background) treatment with Vehicle (n=6) or RMC-7977 (25 mg/kg, po, q.d.; n=8) for 15 days. (b) Tumor growth curves for mice in experiment as depicted in panel (a). Each line represents one mouse and each symbol represents ultrasound scan. (c) Waterfall plot showing percent change in tumor volume compared to baseline of KPCY after 15 days of treatment. (d) RMC-7977 tolerability as assessed by animal body weight change over the course of treatment. (e) Schematic of KPC mice (on 129S4/SvJae background) treatment with Vehicle (n=6) or RMC-7977 (50 mg/kg, po, q.o.d.; n=8) for 1 week. Tissues collected at 4 hours (n=4) or 24 hours (n=4) post last dose. (f) Tumor growth curves for mice in experiment as depicted in panel (e). Each line represents one mouse and each symbol represents ultrasound scan. (g) Waterfall plot showing percent change in tumor volume compared to baseline after 1 week of treatment. (h) RMC-7977 tolerability assessed by animal body weight change from baseline over the course of treatment. (i-k) IHC analysis of KPC tumors. Tumors stained for (i) phospho-ERKT202/204; (j) cleaved PARP, (k) cyclin A2. Quantification of IHC images was compared between Vehicle, RMC-7977 (1 week + 4 hour) and RMC-7977 (1 week + 24 hour). Quantification was based on 10–15 fields of view (light shade), averaged per tumor (dark shade) and means were compared by Student’s unpaired t-test (*, p<0.05; ***, p<0.001; ****, p<0.0001). Error bars indicate s.d. (l,m) KPC mice treated with Vehicle (n=8) or RMC-7977 (50 mg/kg, po, q.o.d., n=8) until endpoint criteria were met. (l) Tumor growth rates calculated from longitudinal tumor volumes. (m) Kaplan-Meier survival analysis comparing RMC-7977 and Vehicle (historical) treatment arms (****, p<0.0001).

