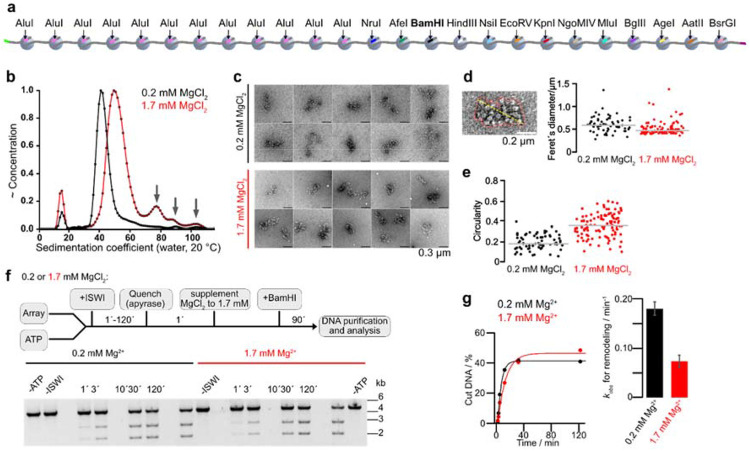
Figure 1. Intramolecular chromatin fiber folding does not impede remodeling.
a, A 25mer nucleosome array assembled on 25 repeats of 197 bp long Widom-601 DNA derivatives. 13 repeats contain unique restriction enzymes sites. b, Sedimentation velocity analysis of 25mer arrays in a buffer supplemented with 0.2 mM (black; peak at 42.4 S) or 1.7 mM MgCl2 (red; peak at 51.3 S). The larger S value at the higher Mg2+-concentration indicated stronger compaction of arrays without substantial oligomer formation (arrows). c, Representative micrographs of 25mer arrays from negative stain electron microscopy dissolved in a buffer supplemented with indicated MgCl2 concentrations. d, e, Single-particle analysis of negative stain EM micrographs. N = 67 (0.2 mM MgCl2); N = 107 (1.7 mM MgCl2). Outlines of single particles (red line) were determined with a trainable Weka segmentation in ImageJ. Feret’ diameter (the maximum distance between two parallel tangential lines, yellow line) and circularity were calculated for all outlines. f, Top: Schematic of the BamHI accessibility assay. Bottom: Gel analysis of remodeling time courses. Reactions contained 4 nM arrays and 5 μM Mg-ATP and were started by addition of 200 nM ISWI. g, Left: quantification of gel in f and exponential fits of the time courses. Right: rate coefficients from single exponential fits. Bars are mean values of two independent experiments, error bars their minimal and maximal values.

