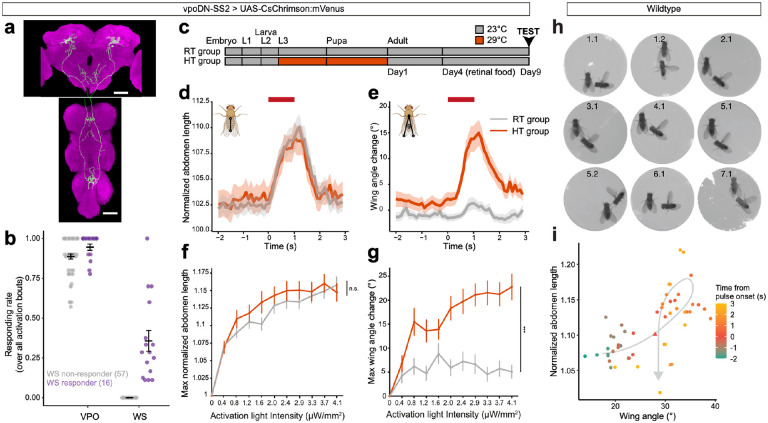
Fig. 5: Idiosyncratic and plastic latent potential of WS in D. melanogaster.
a, Confocal image of vpoDN neurons in D. melanogaster vpoDN-SS2 > UAS-CsChrimson:mVenus in female brain and VNC. Green: mVenus, magenta: nc82. Scale bars: 50 μm.
b, Proportion of VPO and WS events in response to 10 activation bouts with intensities ramping from 0.4 to 4.1 μW/mm2. Each dot represents an individual. Color represents whether an individual was scored as a WS responder (purple) or not (gray). Error bars show mean±SEM.
c, Schematic of how room temperature (RT) and high temperature (HT) groups were generated.
d,e, Mean normalized abdomen length (d) and wing angle change (e) of HT and RT flies at 4.1 μW/mm2. Activation window is denoted by red bars. Shaded areas represent the SEM. Inset diagrams illustrate how abdomen lengths or wing angles were measured.
f,g, Maximum normalized abdomen length (f) and wing angle change (g) under each activation intensity. Curve and error bars show mean±SEM. Wilcoxon rank sum tests were performed between RT and HT across all activation intensities. *** p<0.001, n.s. not significant.
h, WS onset frame of each of the 9 WS events observed in 7 courting wildtype pairs. Numbers denote “pair ID”.“event ID”.
i, Temporal relationship between normalized abdomen length and wing angle, averaged across all WS events. Pulse onset is marked as a triangle. Gray arrow behind data points represents an approximate progression of data points.

