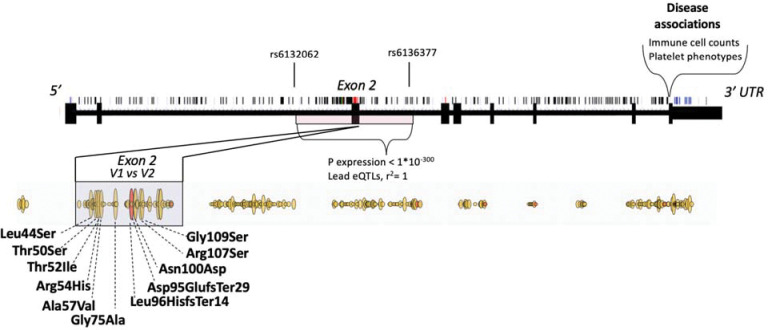
Figure 4. Schematic representation of genetic variation affecting structure, expression and disease associations on SIRPA locus.
Single nucleotide polymorphisms are marked on top of the gene structure. Missense variants are highlighted in red as part of the gene structure and outlined yellow below the gene structure. Frameshift/insertions or deletions are highlighted with red as part of the missense variants. Haplotype from rs6132062 to rs6136377 encompassing exon 2 has the largest impact on SIRPA gene expression in blood. In addition, exon 2 contains missense variants that can be divided into two common haplotypes that are referred to as V1 and V2. V1 allele is shown first in the graph. V1 is in linkage disequilibrium (r2=1) with the SIRPA eQTLs (rs6132062 and rs6136377) having impact therefore both on expression and on coding sequence. Disease associations with SIRPA are located in the 3’UTR including the variants that associate with platelet levels.

