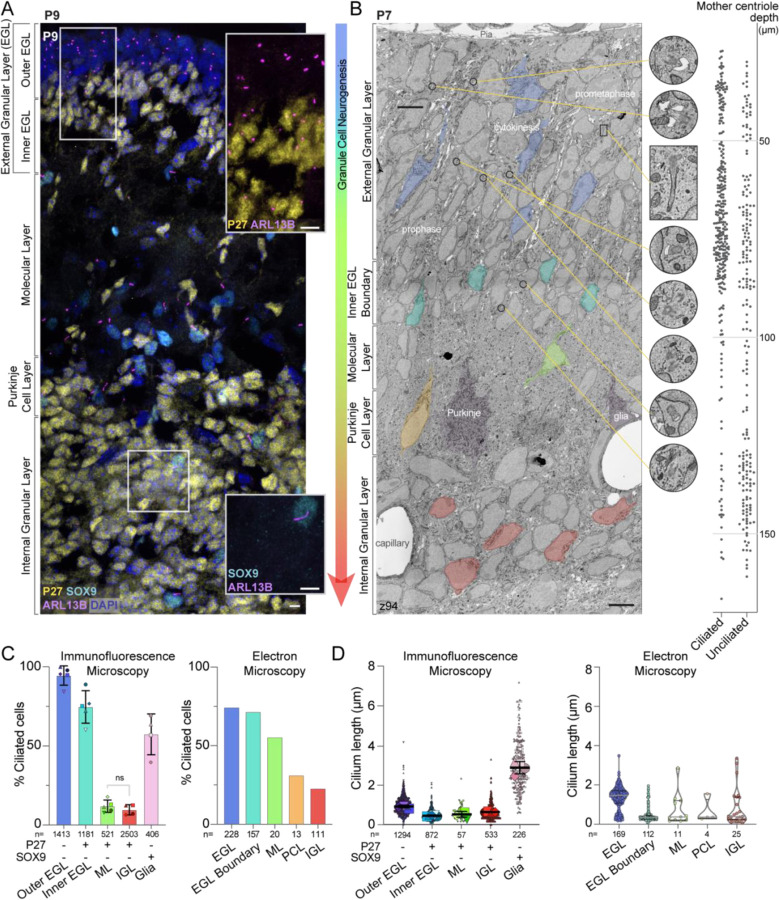
Figure 1. Differentiating GCs initially have short cilia that are lost as neurons mature.
Gradual
(A) A sagittal section of P9 mouse cerebellum immunostained with antibodies to the GC differentiation marker P27KIP (yellow), the cilia marker ARL13B (magenta), the glial marker SOX9 (cyan), and counterstained with DAPI (blue) then imaged with spinning disc confocal microscopy. The layers of the developing cerebellum are indicated on the left. Scale bar: 10 μm.
(B) A single slice of the P7 large serial-section scanning EM volume with GCs in different stages of differentiation are highlighted. The phase of mitotic cells in the EGL are superimposed on the GCs. In addition, cropped images of centrosomes and cilia from the panel are magnified and the location of each image is indicated by a yellow line. On the right side of the image, the depth of each ciliated and unciliated mother centriole is plotted. Scale bar: 5 μm; diameter of zoom regions: 1.6 μm.
(C) Cilia frequency is quantified from measurements of widefield immunofluorescent images (left; 3 sections from each of 4 or 5 animals) and from each annotated mother centriole in the P7 serial scanning EM volume (right). Differentiatng cells in the immunofluorescent images were identified based on expression of P27KIP. Because the EM volumes lacks molecular markers we instead used cellular context and identified GCs near the EGL boundary as a pool of differentiating cells. Glia were included in the immunofluorescent analysis because SOX9 staining allowed us to distinguished them with confidence.
(D) The length of each cilium from the widefield images is plotted on the left where each individual cilium measurement is represented by a small symbol and the average for each animal is represented by the larger symbol. The line and error bars represent the mean and standard deviation of the individual animal averages. The measured length of each cilium annotated in the P7 EM volume is quantified on the right.

