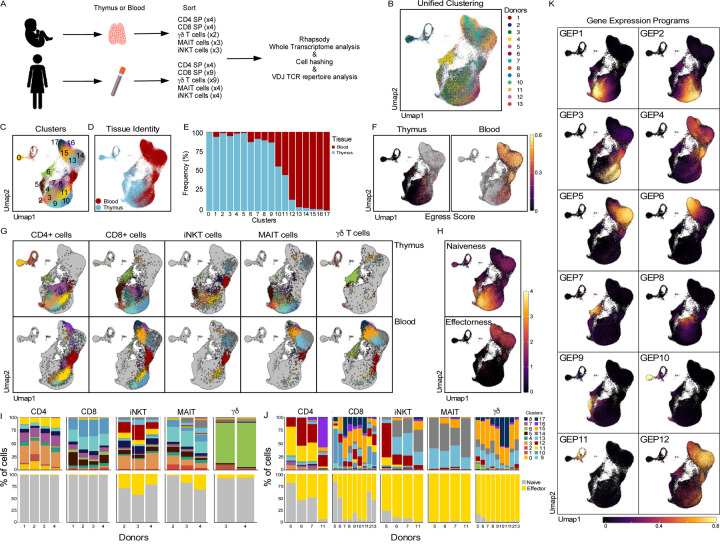
Figure 1: Integrative view on Tinn and Tconv development and peripheral function.
A. Experimental set-up specifying donor type (postnatal/adult), tissue and sorted cell types. B. Harmony batch-corrected and integrated dataset across donors, tissues and cell types. C. Stable Louvain-derived cell clusters distributed across D. both blood and thymus-derived cells and E. their respective frequencies in these clusters. F. ‘Egress’ score on thymus and blood derived cells. G. Cells color-coded by cluster (as in C) and visualized by their hashtag-sorted cell type (columns) and the tissue they originated from (rows). H. Projection of naive and effector scores and the proportion of I. thymic and J. blood cell types per donor classified based on these scores (bottom row); top row shows analogous proportions by cell cluster (as in C). K. Gene expression programs (GEPs) in thymus and blood identified using cNMF. Sample numbers for all panels as depicted in A. Score defining genes as described in text.

