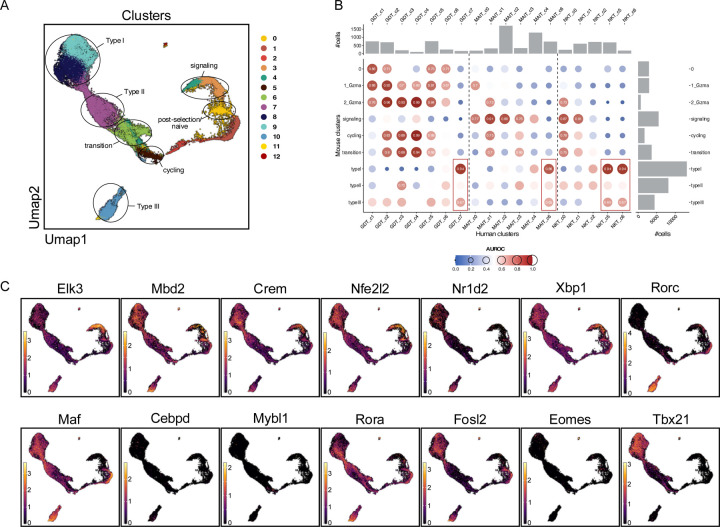
Figure 6: Cross-species comparison of mouse and human Tinn development.
A. Mouse Tinn reference atlas with 7 characteristic cell states highlighted that are found across lineages (as in Supplementary Figure 14). B. Meta-neighbour analyses showing pairwise correspondence (AUROC scores) between murine Tinn (as in A) and human iNKT, MAIT and γδ T cell clusters (as in Figure 2). Marginal bar charts indicate number of cells in the corresponding clusters. C. Expression of human regulon-driving transcription factors (as in Figure 5) together with murine TFs of importance in Tinn development (Rorc, Tbx21) projected on mouse Tinn reference atlas (as in A.)

