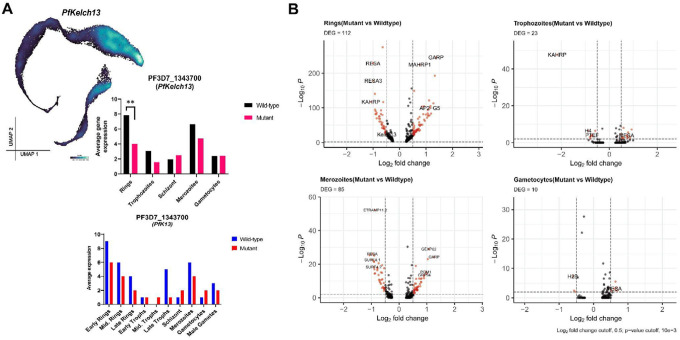
Figure 3: Gene expression differences between K13580Y and K13C580 parasites.
A. Kelch13 gene expression was observed to be downregulated in the K13580Y parasite population compared to the K13C580 (BH-adjusted p-value<0.01 and log2FC=1.5). PfKelch13 gene expression across the parasite stages in each line, shows PfKelch13 gene to be highly expressed in the K13C580 across all the stages compared to K13580Y. B. Volcano plot showing DEGs in the untreated K13580Y compared to untreated K13C580 on different parasite stages. Each red dot denotes genes differentially expressed between the K13C580 and the K13580Y (such as GARP and MAHRP1 which are upregulated in K13580Y rings compared to K13C580 rings).

