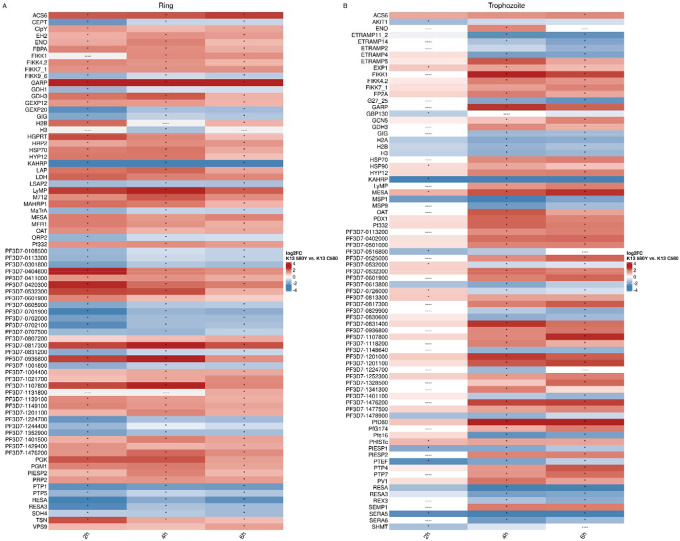
Figure 8. Differential expression results show upregulation of GARP and stress response genes (HSP70, GCN5), perturbations in genes related to protein export (FIKK gene family, EXP1, ETRAMP genes, KAHRP, RESA), and downregulation of genes related to dormancy (SERA5, SERA6).
The union of the top50 differentially expressed genes (by absolute log2FC) per time point between the highest VFC subcluster in K13C580 compared with K13580Y in rings (A) and trophozoites (B). For each timepoint in (A) or (B), the top 50 genes by absolute log2FC were identified. The vectors of the top 50 genes were concatenated and filtered to unique genes. The average log2FC per timepoint is plotted, with “----” indicating genes that were not differentially expressed at that timepoint. An asterisk indicates genes that were significantly differentially expressed at an absolute log2FC > 0.3 and a BH-adjusted p-value of < 0.001.

