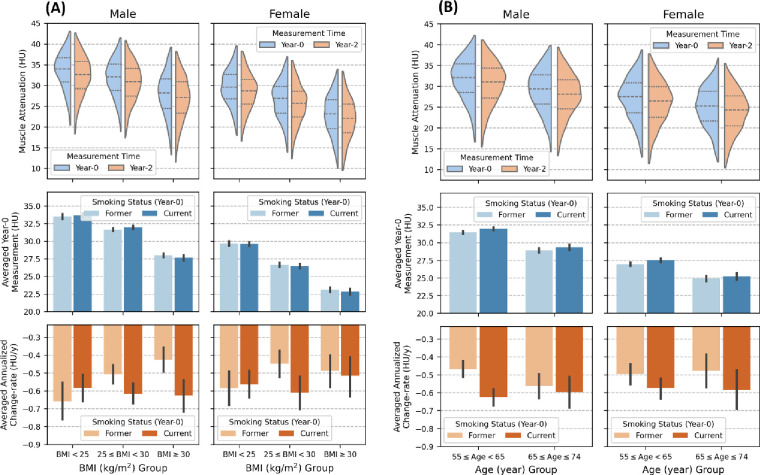
Figure 3:
Sex-stratified muscle attenuation data, further stratified by age and body mass index (BMI), are presented. (A) illustrates data stratified by body mass index (BMI), while (B) shows data stratified by age. In both (A) and (B), the left columns show subplots for males, and the right columns show subplots for females. The top rows illustrate the distribution of attenuation measurements at baseline (year-0) screening (blue) and measurements at year-2 screening (orange) for those with valid year-2 follow-up scan. The middle rows display the estimated mean baseline attenuation for each subgroup, stratified by baseline smoking status. The bottom rows show the estimated mean annualized attenuation change-rage (HU/y) for each subgroup, stratified by baseline smoking status. HU= Hounsfield Unit. BMI=Body Mass Index. COPD=Chronic Obstructive Pulmonary Disease.

