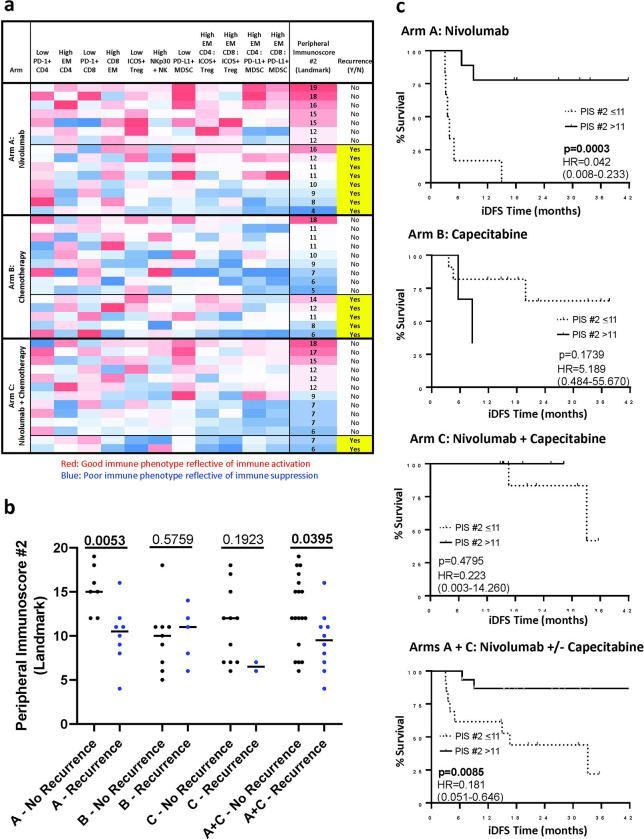
Fig. 4. Peripheral immunoscore #2 at landmark associates with disease recurrence in patients receiving nivolumab or nivolumab +/− chemotherapy.
(A) Heatmap representing the frequency at landmark of refined peripheral blood mononuclear cell (PBMC) subsets of cell types reflecting known function (Supplementary Table 9) that were used to generate an immunoscore (peripheral immunoscore #2) in patients enrolled in arms A (n=15), B (n=14), C (n=13), and arms A and C combined (n=28). Each row corresponds to one patient. The peripheral immunoscore #2 is the sum of points assigned to each subset based on tertile distribution as previously described 42. (B) Association between the peripheral immunoscore #2 calculated in A with disease recurrence following therapy in each arm and arms A and C combined. Peripheral immunoscore #2 was compared in patients with no disease recurrence (no R) vs patients with disease recurrence (R) in Arm A (n=7 no R, n=8 R), Arm B (n=9 no R, n=5 R), Arm C (n=11 no R, n=2 R), and Arms A + C combined (n=18 no R, n=10 R). Medians with p values are shown; p values were calculated by a two tailed Mann-Whitney test. (C) Association between the peripheral immunoscore #2 calculated in A and iDFS in arms A (n=15), B (n=14), C (n=13), and arms A and C combined (n=28), were analyzed using a Log-rank (Mantel-Cox) test. Hazard ratio and 95% confidence interval, calculated by the Mantel-Haenszel method, are indicated. Solid line: patients with peripheral immunoscore #2 (PIS #2) > the median; dashed line: patients with PIS #2 ≤ the median.
PD-1, programmed cell death protein 1; EM, effector memory; NK, natural killer cells; NKp 30, natural killer cells activating receptor 30; ICOS, inducible T cell co-stimulator; Treg, regulatory T cell; MDSC, myeloid-derived suppressor cells. Source data are provided as a source data file.

