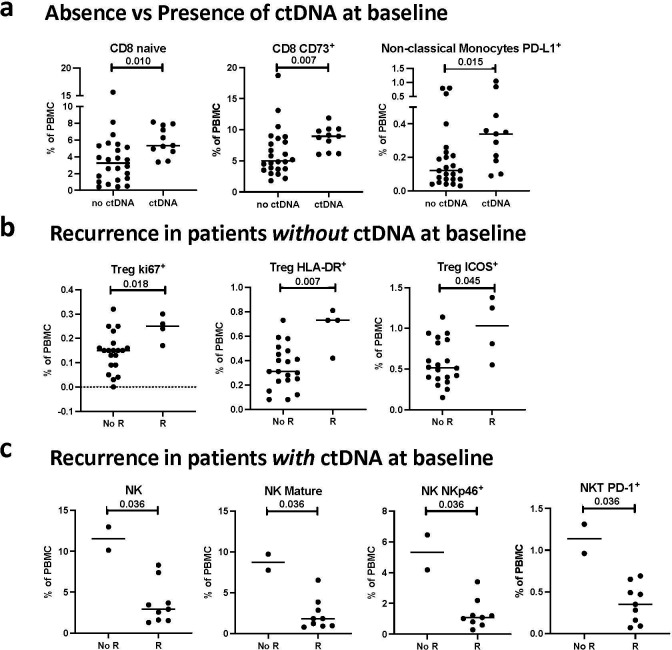
Fig. 5. Association of the peripheral immune profile at landmark in patients from Arms A, B and C combined with the presence of ctDNA at landmark and recurrence.
The peripheral immune profile was compared at landmark in all arms combined between patients with presence and absence of landmark ctDNA. Frequency of PBMC subsets at landmark that differed between (A) patients with (n=11) and without (n=24) ctDNA at landmark, (B) patients without ctDNA at landmark who recurred (R, n=4) vs. did not recur (no R, n=20) after therapy, and (C) patients with ctDNA at landmark who recurred (R, n=9) and did not recur (no R, n=2) following therapy. Differences were analyzed in 10 classic PBMC cell types and 148 refined PBMC subsets reflective of maturation and function. Notable subsets with significant differences are displayed and include those with p < 0.05 (calculated by a two tailed Mann-Whitney test), and a difference in medians > 0.05 of PBMCs. No adjustments were made for multiple comparisons.
ctDNA, circulating tumor DNA; PBMC, peripheral blood mononuclear cells; PD-L 1, programmed death-ligand 1; Treg, regulatory T cell; HLA-DR, Human Leukocyte Antigen – DR isotype; ICOS, inducible T cell co-stimulator; NK, natural killer cells; NKp46, natural cytotoxicity triggering receptor 1. Source data are provided as a source data file.

