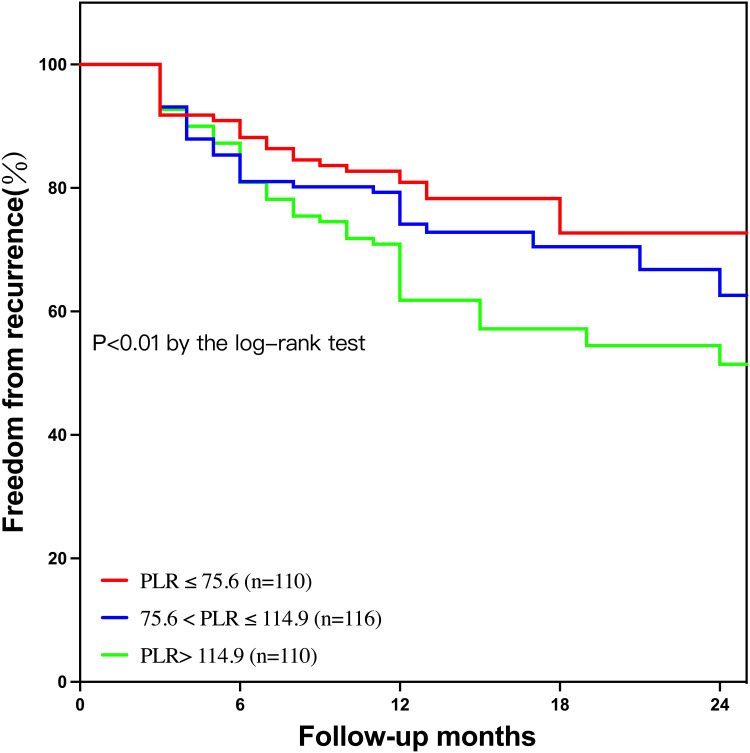
Figure 3.
Kaplan‒Meier survival curves of AF recurrence for the PLR tertiles. The graph shows Kaplan–Meier estimates of freedom from any documented atrial arrhythmia after a single ablation procedure (log-rank P<0.01) in the T1 group (TyG index ≤ 75.6, red line), T2 group (75.6 < PLR ≤ 114.9, blue line), and T3 group (PLR> 114.9, green line).
Abbreviations: AF, atrial fibrillation; PLR, platelet to lymphocyte ratio.

