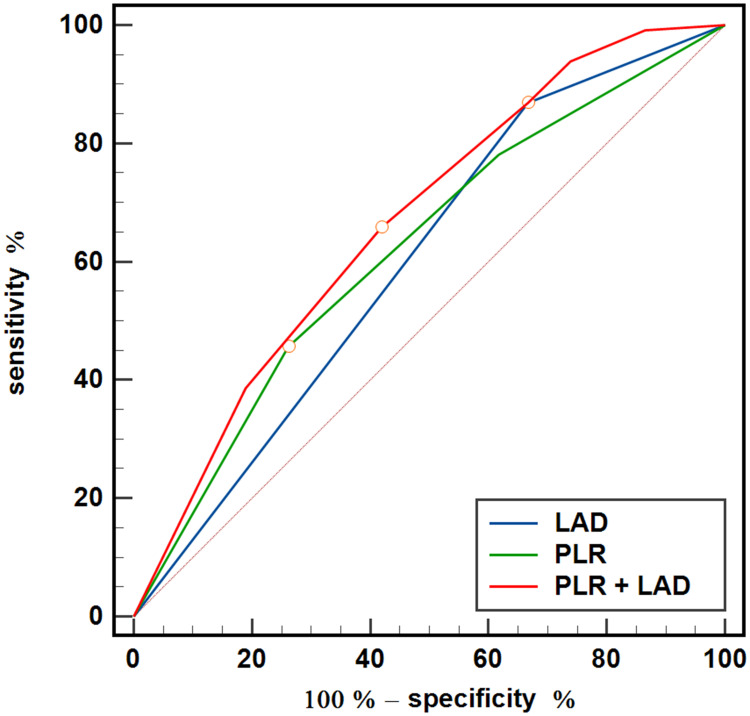
Figure 4.
ROC curve analysis of the PLR, APPLE score and APPLE score plus PLR to predict recurrence in patients with nonparoxysmal atrial fibrillation. The PLR was stratified by the tertiles of the PLR (T1, PLR ≤ 75.6; T2, 75.6 < PLR ≤ 114.9; T3, PLR> 114.9). The LAD groups were stratified by the optimal cut-off value (LAD≥42 mm). The area under the curve (AUC) of the LAD, the PLR and the addition of the PLR to the LAD for predicting recurrence was 0.645 (95% CI, 0.601 to 0.690; P < 0.001), 0.596 (95% CI, 0.557 to 0.634; P < 0.001) and 0.675 (95% CI, 0.629 to 0.722), respectively. LAD vs LAD + PLR, P<0.001. The circle on the curve indicates the point corresponding to the optimal value.
Abbreviations: ROC, receiver operating characteristic; PLR, platelet to lymphocyte ratio.

