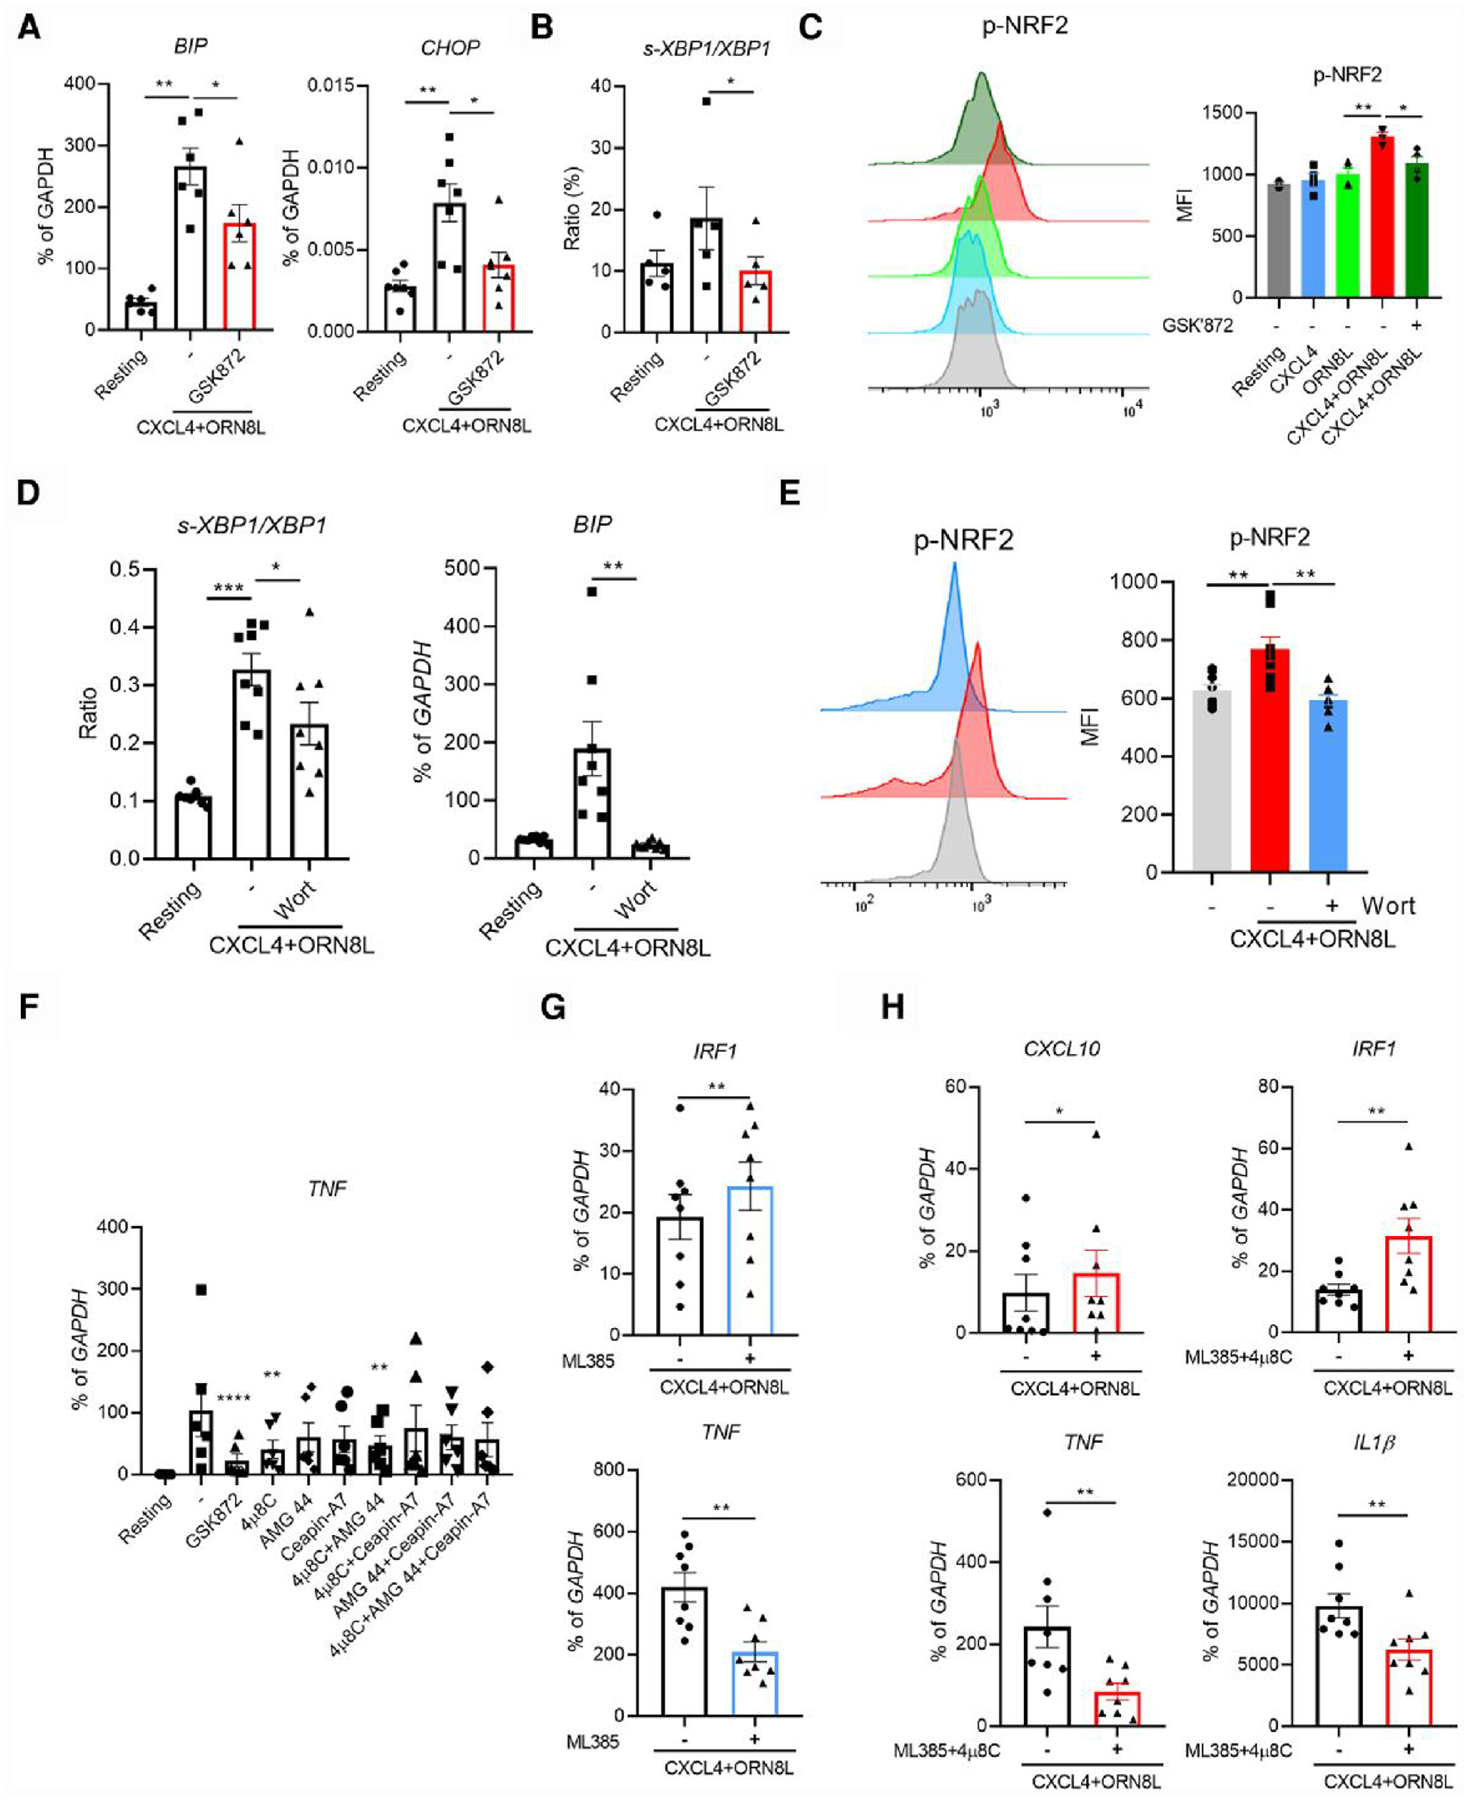
Fig. 5.

XBP1 and NRF2 activation contributes to RIPK3-AKT mediated regulation of gene expression. (A, B, and D) BIP, CHOP, and s-XBP1/XBP1 mRNA was measured by qPCR and normalized relative to GAPDH mRNA (n = 6 for panels A and B, n = 8 for panel D). (C, E) Representative flow plot and bar graph showing phospho-NRF2 in the indicated conditions. (F–H) Gene expression was evaluated by qPCR and normalized relative to GAPDH mRNA in the indicated conditions at 6 h (at least 6 healthy donors). Data are depicted as mean ± SEM. The representative flow plots are from at least 3 independent experiments (C and E). **P ≤ 0.01; *P ≤ 0.05 by 1-way analysis of variance with Tukey’s post hoc test for multiple comparisons (A, B, D, and F) or by Wilcoxon matched signed rank test (G and H).
