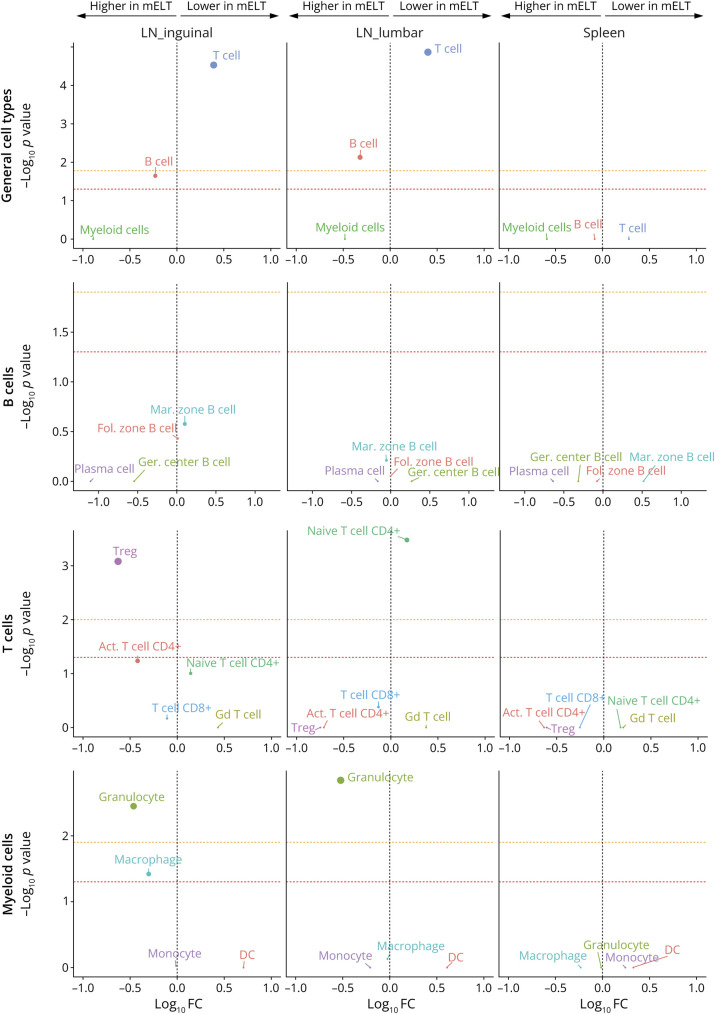
Figure 3. Distinct Changes in Cell Composition Distinguish Meningeal Ectopic Lymphoid Tissue From Secondary Lymphoid Organs.
Plot of differences in cluster abundance in mELT compared with inguinal lymph nodes, lumbar lymph nodes, and spleen, plotting fold change (log10) against p value (-log10) based on the Welch t test (see methods for details). Horizontal dotted lines indicate significance threshold (p = 0.05), before (red) and after (orange) Bonferroni correction for multiple testing. n = 6 for mELT and lumbar LN, n = 3 for inguinal LN, and n = 2 for spleen.

