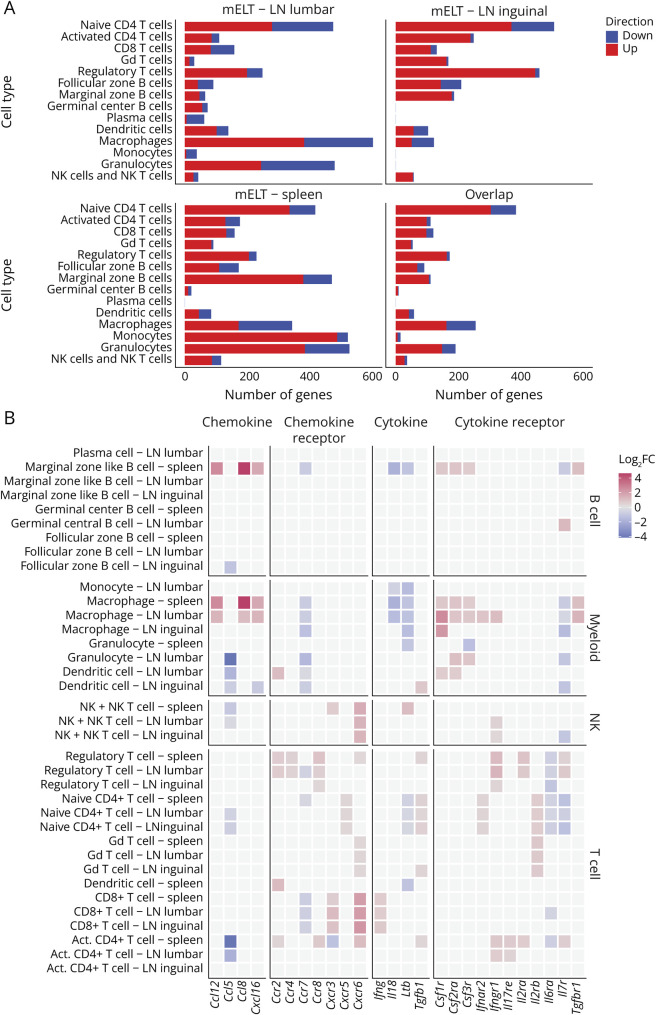
Figure 4. Gene Expression Analysis Defines the Pro- and Anti-inflammatory Profile of Meningeal Ectopic Lymphoid Tissue.
(A) Number of differentially expressed genes (DEG) between mELT and SLOs per cell cluster. x-axis represents the number of DEGs between mELT and lumbar lymph nodes (LN), inguinal LN, and spleen. The overlap contains all genes significantly differentially expressed between mELT and at least 2 of 3 of the SLOs. Downregulated genes are shown in blue; upregulated genes are shown in red. The y-axis shows the cell clusters. Ribosomal protein genes were not counted. (B) Cytokine-related gene expression differences between mELT and SLOs. Color reflects log2 fold change (FC) between mELT and the indicated SLOs (LN lumbar, LN inguinal, or spleen). Gray squares mean there was no significant difference (significance level p = 0.05). Cytokine genes shown are the ones for which the authors found significant differences in at least 2 of 3 tissue comparisons for at least one of the cell types.

