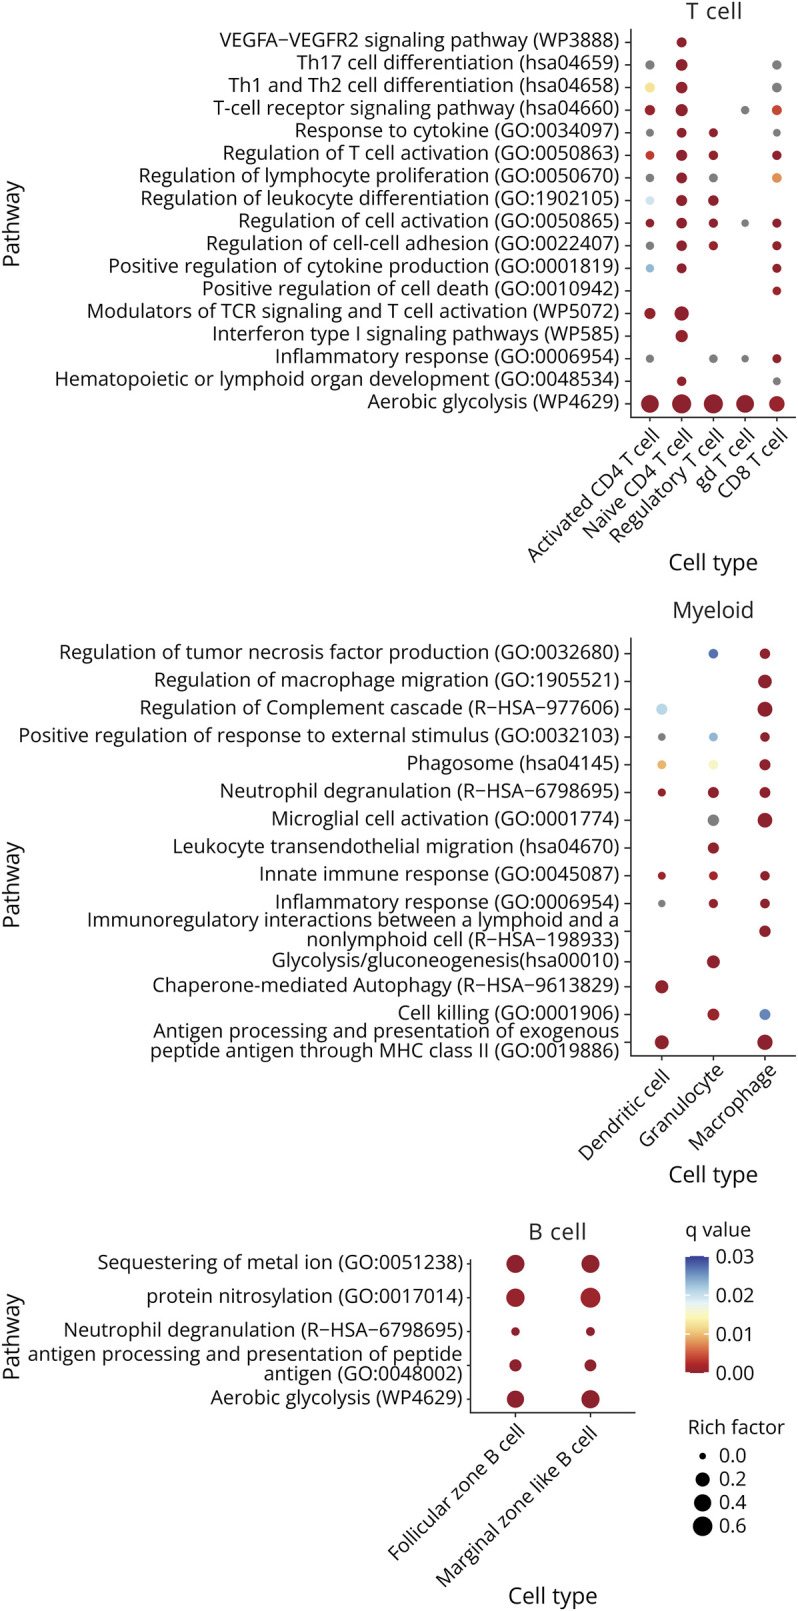
Figure 5. Functional Enrichment Analysis for Genes Differentially Expressed Between mELT and SLOs Using Metascape.

The overlap gene list (see Figure 4A) was used as input for the functional enrichment analysis. Figure shows a summary of the statistically most enriched pathways (adjusted p value<0.001 for at least 1 cell type) for T-cell, B-cell, and myeloid cell subtypes. Redundant pathways were collapsed into a single biological theme. The dot size reflects the rich factor (ratio of the DEG number and the total number of genes annotated in this GO term) and its color the corresponding statistical significance (q value, Bonferroni corrected). For gray dots, the pathway was significant based on p value, but not on q value. Absence of a dot indicates the annotation was not significantly enriched for this cell type. Cell clusters that are missing for specific tissue comparisons were not analyzed because either too little cells were picked up (<50 cells), or the amount of differentially expressed genes was too small (<20). Ribosomal protein genes were not considered for functional enrichment analysis. Complete functional enrichment analysis results are summarized in eTable 6 (links.lww.com/NXI/A947).
