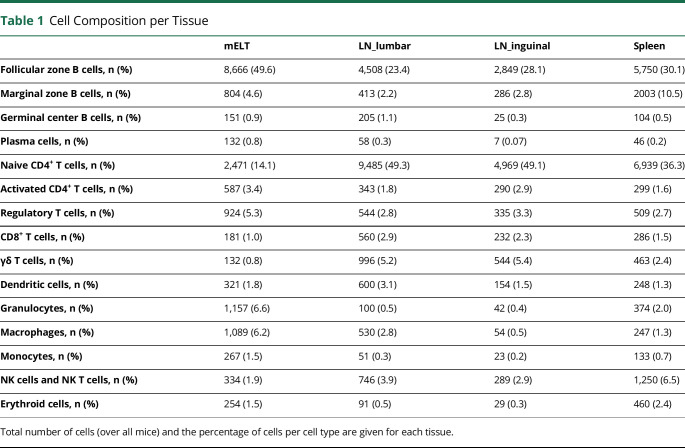
Table 1.
Cell Composition per Tissue
| mELT | LN_lumbar | LN_inguinal | Spleen | |
| Follicular zone B cells, n (%) | 8,666 (49.6) | 4,508 (23.4) | 2,849 (28.1) | 5,750 (30.1) |
| Marginal zone B cells, n (%) | 804 (4.6) | 413 (2.2) | 286 (2.8) | 2003 (10.5) |
| Germinal center B cells, n (%) | 151 (0.9) | 205 (1.1) | 25 (0.3) | 104 (0.5) |
| Plasma cells, n (%) | 132 (0.8) | 58 (0.3) | 7 (0.07) | 46 (0.2) |
| Naive CD4+ T cells, n (%) | 2,471 (14.1) | 9,485 (49.3) | 4,969 (49.1) | 6,939 (36.3) |
| Activated CD4+ T cells, n (%) | 587 (3.4) | 343 (1.8) | 290 (2.9) | 299 (1.6) |
| Regulatory T cells, n (%) | 924 (5.3) | 544 (2.8) | 335 (3.3) | 509 (2.7) |
| CD8+ T cells, n (%) | 181 (1.0) | 560 (2.9) | 232 (2.3) | 286 (1.5) |
| γδ T cells, n (%) | 132 (0.8) | 996 (5.2) | 544 (5.4) | 463 (2.4) |
| Dendritic cells, n (%) | 321 (1.8) | 600 (3.1) | 154 (1.5) | 248 (1.3) |
| Granulocytes, n (%) | 1,157 (6.6) | 100 (0.5) | 42 (0.4) | 374 (2.0) |
| Macrophages, n (%) | 1,089 (6.2) | 530 (2.8) | 54 (0.5) | 247 (1.3) |
| Monocytes, n (%) | 267 (1.5) | 51 (0.3) | 23 (0.2) | 133 (0.7) |
| NK cells and NK T cells, n (%) | 334 (1.9) | 746 (3.9) | 289 (2.9) | 1,250 (6.5) |
| Erythroid cells, n (%) | 254 (1.5) | 91 (0.5) | 29 (0.3) | 460 (2.4) |
Total number of cells (over all mice) and the percentage of cells per cell type are given for each tissue.

