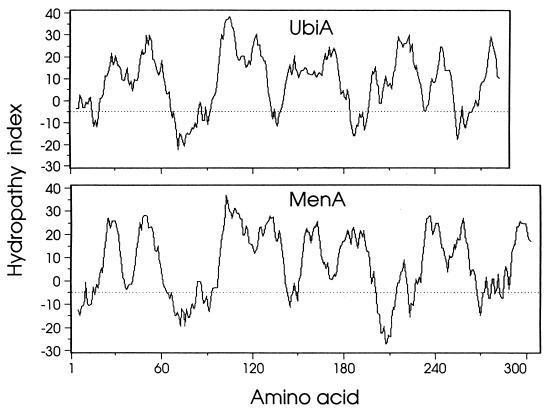
FIG. 5.
Hydrophobicity comparison of the deduced menA- and ubiA-encoded polypeptides. Hydrophobic values are given on the ordinate. Positive hydrophobic values indicate hydrophobic regions, and negative values indicate hydrophilic regions. Amino acid residue numbers are shown on the abscissa. A moving 11-amino-acid window was used to generate the plots. E. coli ubiA polypeptide (25).

