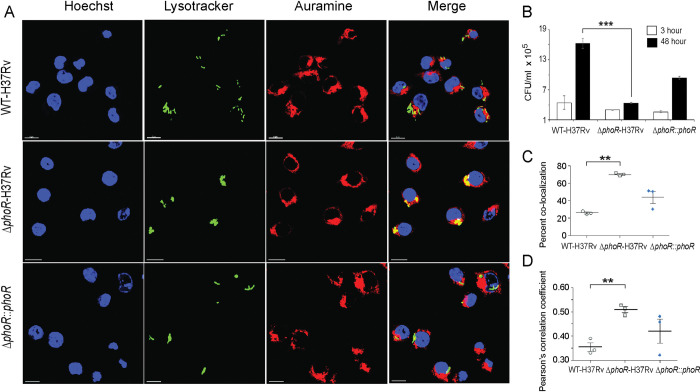
Fig 7. PhoR contributes to mycobacterial survival in cellular models.
(A) WT-H37Rv and ΔphoR-H37Rv were used to infect murine macrophages. Mycobacteria and host cells were stained with phenolic auramine solution, and LysoTracker respectively. Host cell nuclei were made visible by Hoechst dye. Three fluorescence signals (Mycobacterial strains: green; lysosomes: red and host nuclei: blue) and their merging are displayed by confocal images (scale bar: 10 μm). (B) To examine contribution of PhoR to mycobacterial survival in cellular models, murine macrophages were infected with indicated mycobacterial strains, and 3- hour and 48-hour post infection intracellular bacterial CFU were enumerated. The results show average values from biological triplicates (***P<0.001). (C) Co-localization of auramine labelled mycobacterial strains with Lysotracker was investigated by visually scoring yellow and green punctas from at least 50 infected cells originating from 10 different fields of each of the three independent biological replicates. To determine percent co-localization, the number of yellow punctas were divided by the total number of punctas (yellow plus green) as described previously [72,73]. The results display average values from 50 infected cells (n = 50) of each independent experiment with standard deviations from three biological replicates (***P≤ 0.001). (D) The data present Pearson’s correlation coefficient of images displaying internalized auramine-labelled mycobacteria and Lysotracker red marker in macrophages, and were evaluated using image-processing software NIS elements (Nikon). Average values with standard deviations were obtained from three independent experiments (*P<0.05; ***P<0.001).

