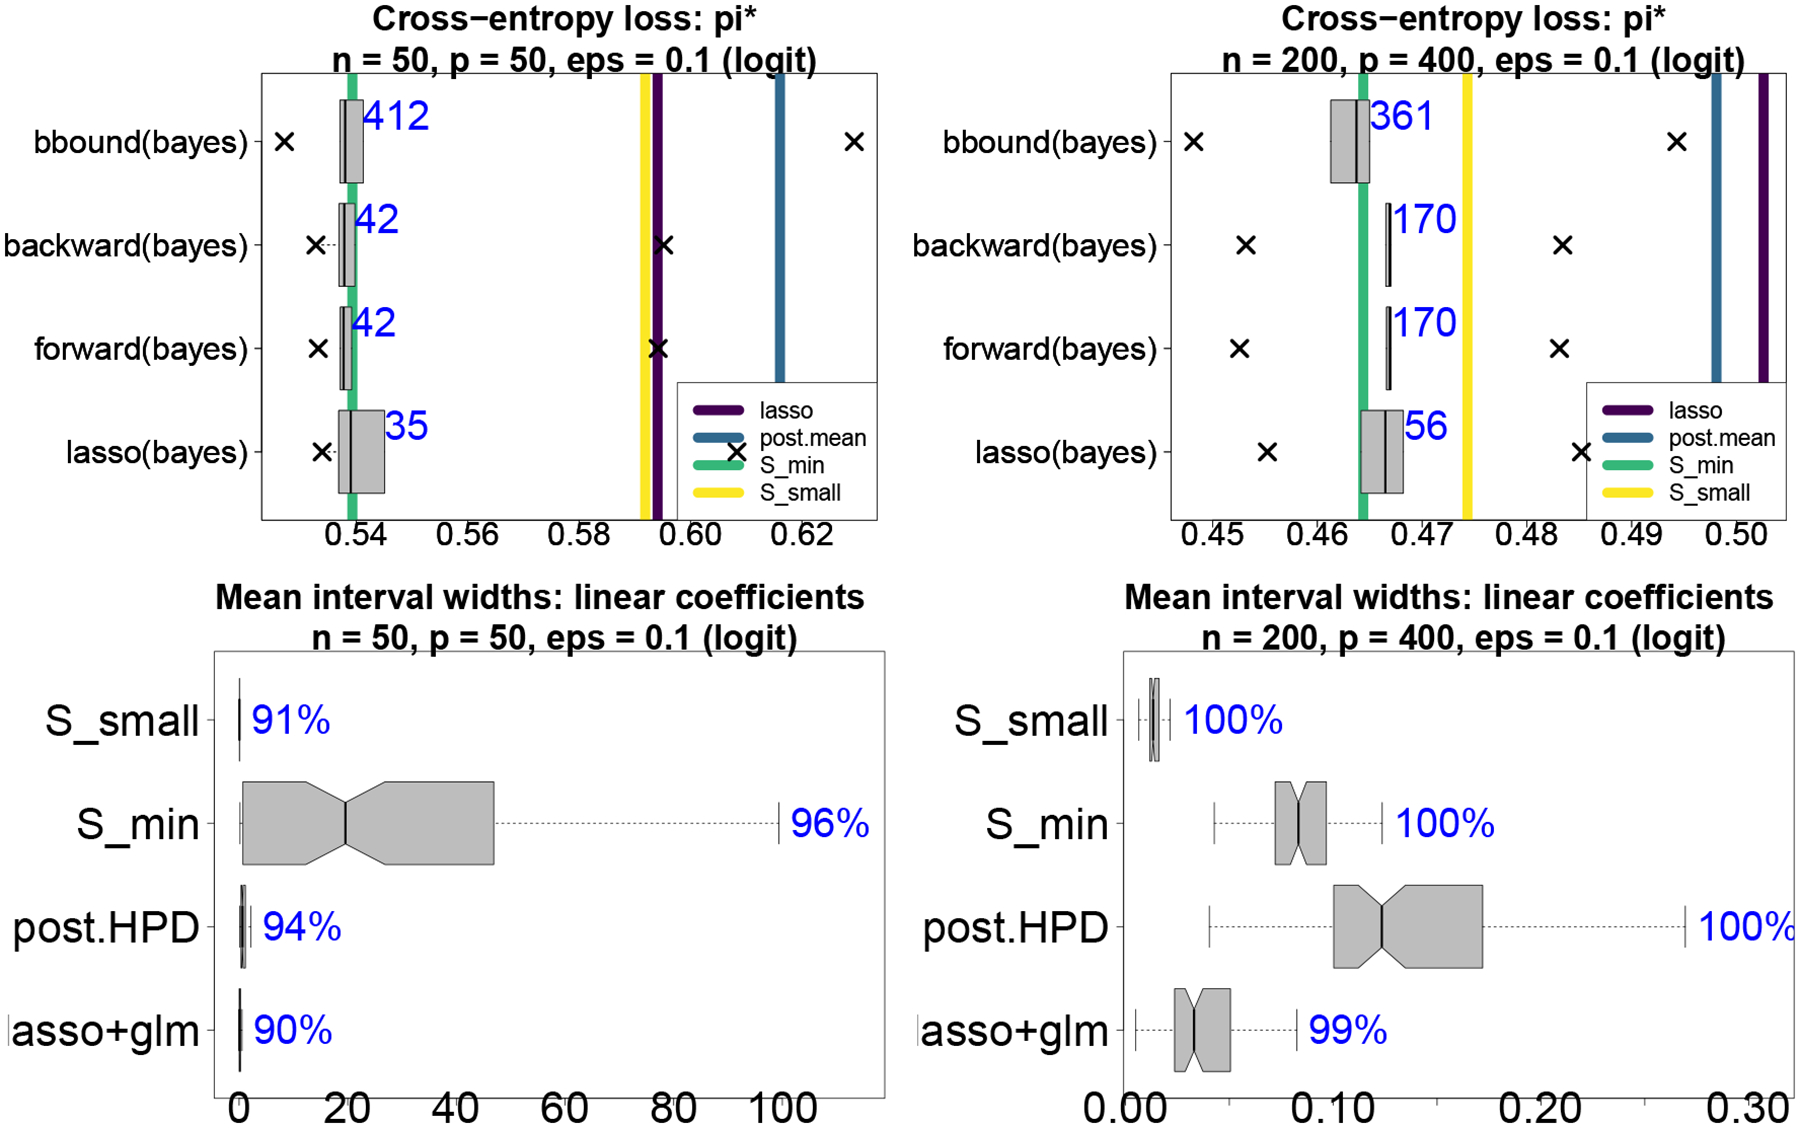
Figure B.1:

Top: cross-entropy loss for . The boxplots summarize the cross-entropy quantiles for the subsets within each acceptable family, while the vertical lines denote cross-entropy of competing methods. The average size of each acceptable family is annotated. Bottom: Mean interval widths (boxplots) with empirical coverage (annotations) for .
