
Figure C.1:
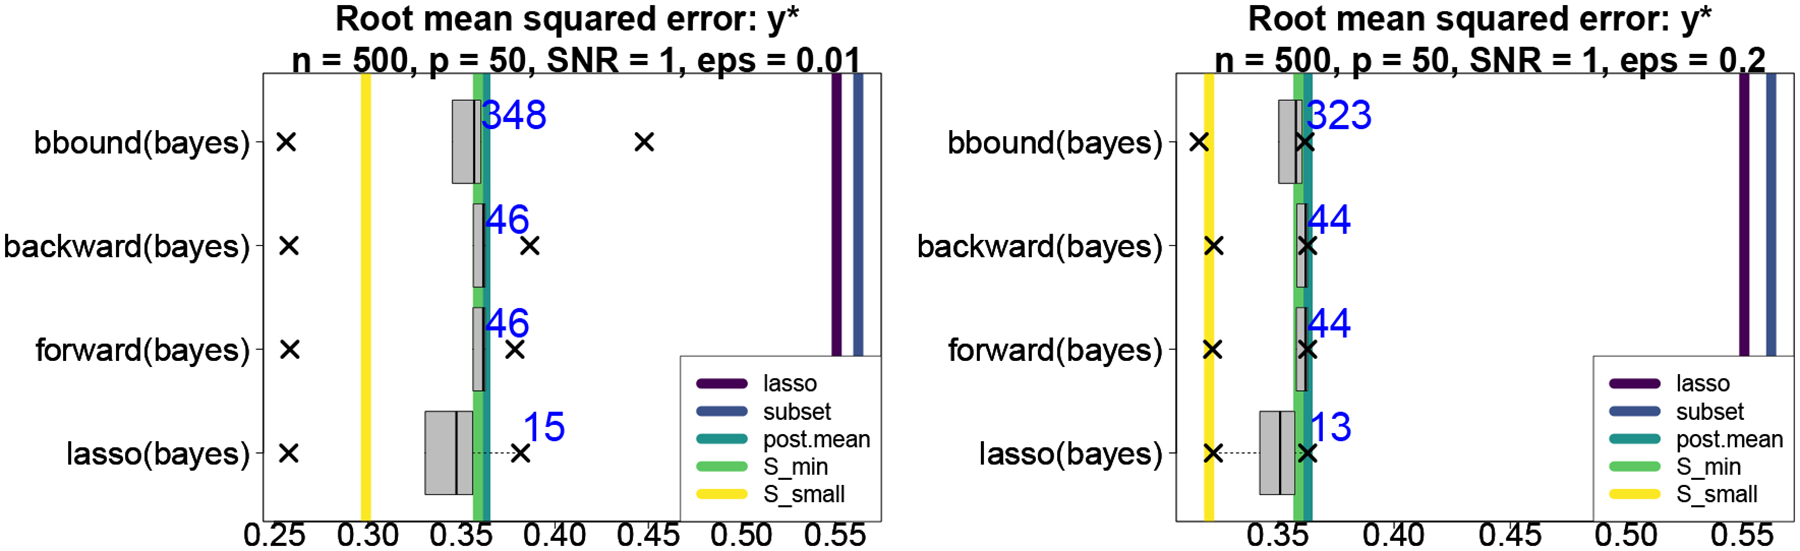
Root mean squared errors (RMSEs) for predicting . The boxplots summarize the RMSE quantiles for the subsets within each acceptable family; here, the acceptable families use (left) and (right). The vertical lines denote RMSEs of competing methods and the average size of each acceptable family is annotated. The results suggest only minor sensitivity to the choice of .