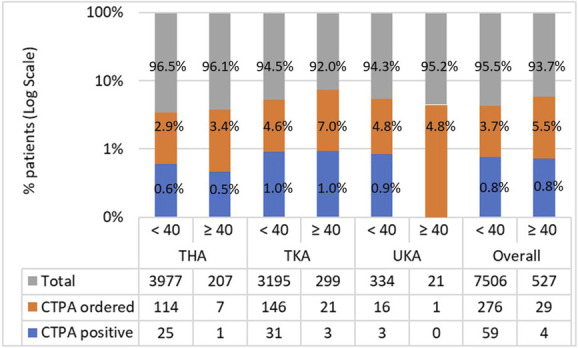
Fig. 2.

This bar chart shows the number of CTPAs ordered and number of positive scans, expressed as logarithmic proportions of the total number of operations, according to BMI category and joint replaced. Absolute numbers are given in the table below. A color image accompanies the online version of this article.
