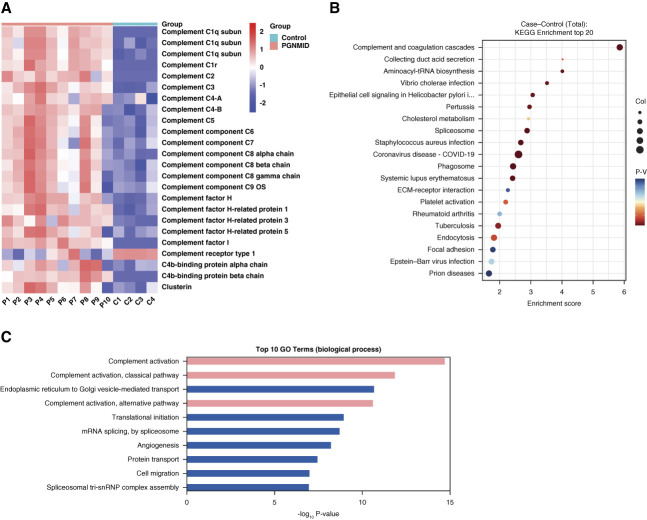
Figure 1.
Differentially expressed proteins between patients with PGNMID and healthy controls. (A) Heatmap of glomerular complement protein and complement regulatory protein abundance in patients with PGNMID and healthy controls. Each column represents an individual patient with PGNMID (P1–P10) or healthy control (C1–C4). Each row represents protein abundance. Red represents higher protein expression, and blue represents lower protein expression. Scale −2 to 2 reflects relative protein expression rescaled within each protein by centering at 0 and dividing by the SD. (B) Scatterplot for the top 20 pathways in KEGG enrichment of differentially expressed proteins between patients with PGNMID and healthy controls sorted by the −log10 P value. The enrichment score was calculated according to the number of annotated genes and that of all annotated genes in this pathway term (see Methods in detail). Lower P values indicate higher pathway enrichment. (C) Top ten gene ontology terms in the biological process of differentially expressed proteins between patients with PGNMID and healthy controls sorted by the −log10 P value. COVID-19, coronavirus disease 2019; KEGG, Kyoto Encyclopedia of Genes and Genomes; PGNMID, proliferative glomerulonephritis with monoclonal immunoglobulin deposits.

