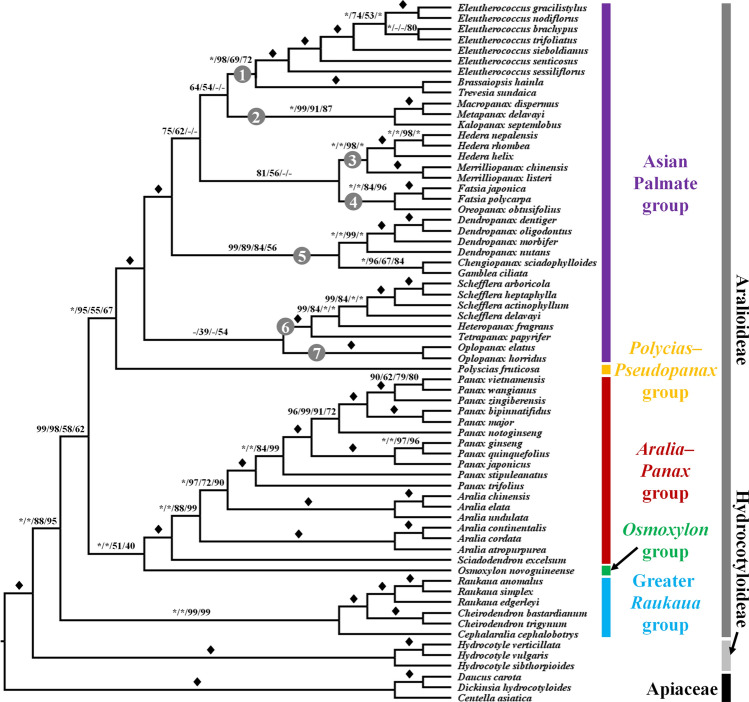
Figure 1.
A summary of Araliaceae phylogenies inferred from four different datasets. Bootstrap values calculated by maximum-likelihood analyses of whole-plastome sequences, concatenated protein-coding gene sequences, first and second sites of CDSs, and amino acid sequences, respectively, are shown near branches. Solid diamonds indicate full support (100%) from four different datasets, and asterisks indicate full support from the corresponding dataset. Hyphens indicate missing values owing to different results for the topology of the corresponding dataset. Clades marked by numbers in gray circles correspond to the clades shown in Fig. 2.

