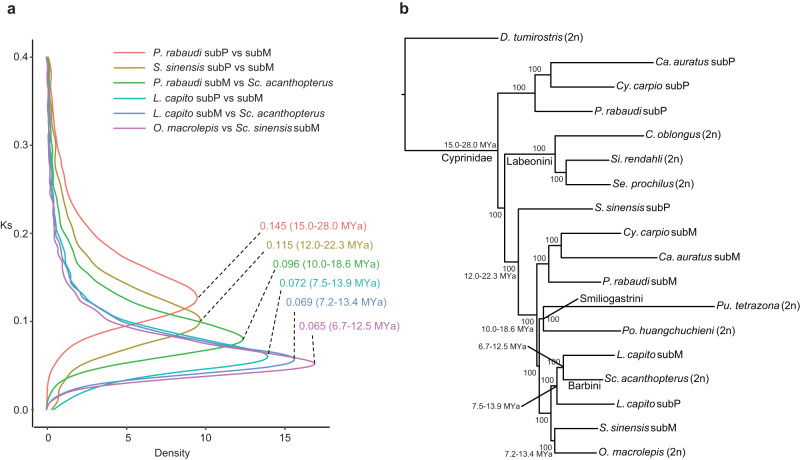
Fig. 3. Time estimates of polyploid events and phylogeny relationship between potential diploid ancestors and allotetraploids.
a Distribution of synonymous substitution rates (Ks) between species and between subP and subM. Numbers at distribution peaks indicate median Ks values. b The phylogenetic relationship of possible diploid ancestors and allotetraploid subgenomes. The ML tree based on CDS of 1669 one to one orthologs from 13 species was created by IQ-TREE. We used Distoechodon tumirostris as the outgroup.

