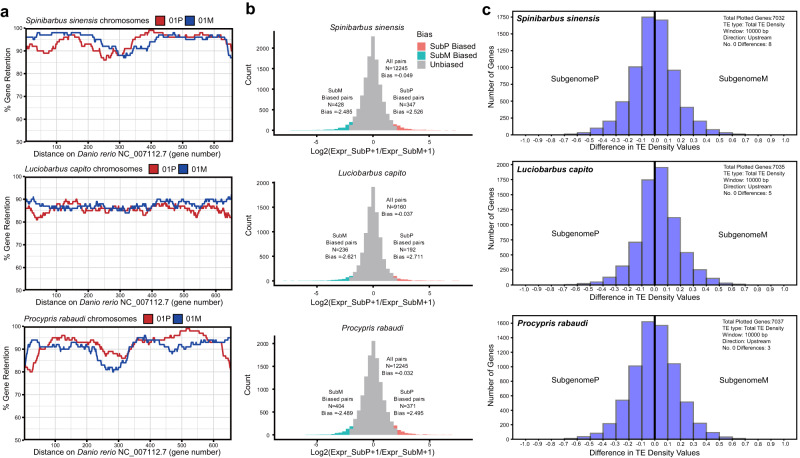
Fig. 4. Gene fractionation, gene expression and TE density of subgenomes.
a Subgenome fractionation of allotetraploids S. sinensis, L. capito, and P. rabaudi relative to the diploid Danio rerio. Gene retention in focal tetraploid subP (red) and subM (blue) was calculated in 100 gene sliding windows and displayed for chromosome 1 of each tetraploid species. Gene retention of the rest chromosomes of each tetraploid was showed in Supplementary Figs. 18–20; b Global subgenome expression bias in the brain tissue of studied tetraploid species, with biased gene counts colored according to subP (red) and subM (blue). Subgenome expression bias in the rest five tissues eye, gill, heart, liver and muscle of studied tetraploid species was shown in Supplementary Fig. 36; c Histograms of differences in TE density values of subP and subM syntelogs of S. sinensis, L. capito, andP. rabaudi. Density values were calculated for all TEs in a 10,000 bp window upstream of genes and difference values were calculated by subtracting TE density of subM syntelogs from subP syntelogs. Negative values represent higher TE density for subM syntelogs, whereas positive values reflect higher TE density for subP syntelogs.

