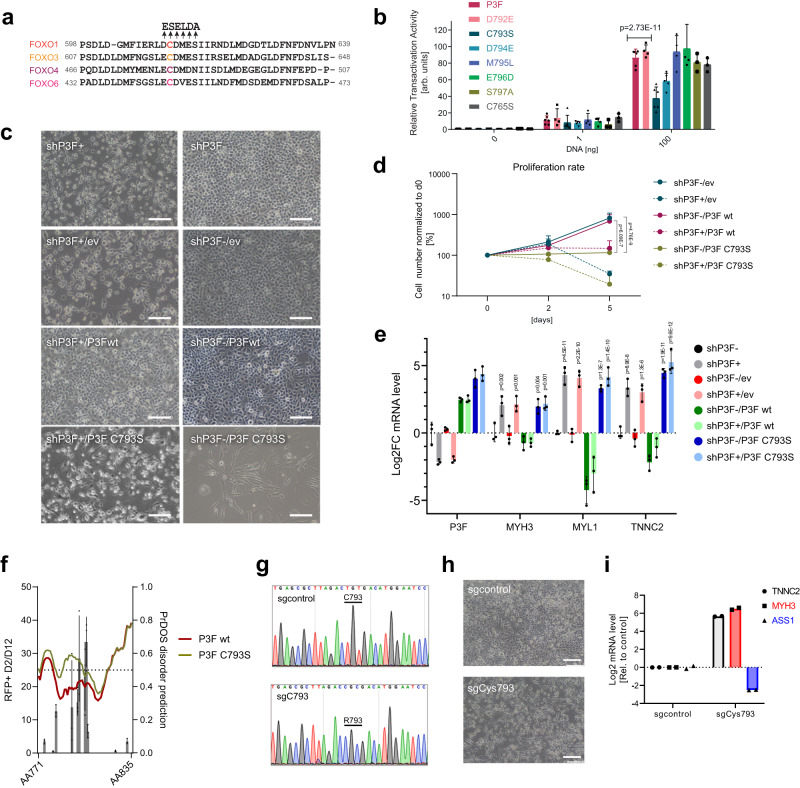
Fig. 2. Mutation of C793 reduces transcriptional activity of P3F and induces differentiation of FP-RMS cells.
a Alignment of amino acid sequences of FOXO family members around C612 of FOXO1 (C793 of P3F) (based on UniProt). Arrows indicate amino acids that were mutated in P3F for functional tests. b Luciferase reporter assay performed with HEK293T cells 48 h after transfection with either wildtype P3F or P3F containing indicated mutations. Plotted are mean ± SD of each construct normalized to an internal transfection control (Renilla luciferase) (n = 6 (P3F, C793S), n = 5 (D794), n = 4 (D792, M795, E796) and n = 3 (S795, C765) independent experiments, two-way Anova, Tukey’s multiple comparisons test). c Morphology of RH4 cells before (right panels) and after (left panels) silencing of endogenous P3F (shP3F) using a dox-inducible shRNA and rescued with either empty vector (ev), wild type P3F (P3Fwt) or C793S mutant P3F (C793S), respectively. Scale bar, 100 μm. d Proliferation curve of cells described in c, as determined by cell counting (n = 3 independent experiments; means ± SD, two-way Anova, Tukey’s multiple comparisons test). e mRNA levels of indicated genes in cells described in c 48 h after silencing of P3F. Data is normalized to shP3F d0 control. Plotted are means ± SD (n = 3 independent experiments, two-way Anova, Tukey’s multiple comparisons test, comparison to shP3F). f Disorder prediction of the C-terminal region (amino acid 777-831) of wildtype (red) and C793S mutant (green) P3F calculated with PrDOS (www.predictprotein.org). Results of the domain screen from b are overlaid as black bars (n = 3 independent experiments, plotted as means ± SD). g Sanger sequencing chromatograms depicting the region around C793 in endogenous P3F before and after base editing in Rh4-ABE8e cells. An amplicon covering C793 was amplified with cDNA from cells transduced with a control sgRNA (upper panel) or an sgRNA recruiting the ABE8e base editor to C793 (lower panel). h Phase contrast pictures of the same cells as described in g, 3 days after transduction. Scale bar, 400 μm. i mRNA levels of indicated genes measured in cells as described in g 5 days after transduction (n = 2 independent experiments). Source data are provided as a Source Data file.

