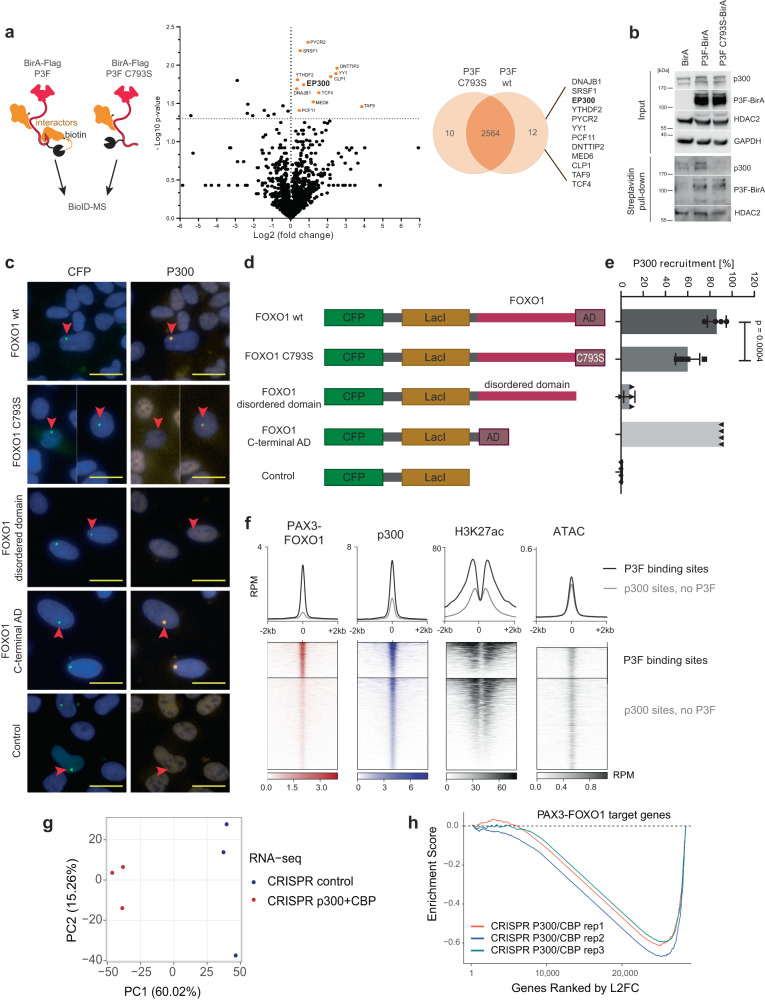
Fig. 4. Mutation of C793 affects binding of P3F to CBP/p300.
a Left panel, schematic of design for BioID experiment. Center panel, volcano plot depicting results of the BioID experiment using HEK293T cells transfected with P3F-BirA or C793S mutant P3F-BirA for identification of interactors. Log2 fold change of total spectral counts measured by mass spectrometry from the comparison of wildtype and C793S mutant P3F is shown (n = 3 independent experiments, unpaired two-tailed T-test). Right panel, Venn diagram depicting differences in the interactome of wildtype P3F versus C793S mutant P3F. The 12 proteins specific for wildtype P3F are indicated on the right. b Validation of BioID-MS results by Western Blot. BioID labeling was performed in 293T cells transfected with BirA or wildtype or C793S mutant P3F-BirA fusion protein constructs. Indicated proteins were detected in cell lysates for detection of input levels (upper panels) and in streptavidin pull-downs for evaluation of biotinylation levels (lower panels). One representative experiment from n = 2 is shown. c Representative pictures from the p300 recruitment assay performed with Lac-U2OS cells transfected with indicated LacI-CFP-FOXO1 fusion constructs. The CFP signal indicates the location of the LacI-CFP fusion; presence of p300 was determined by immunofluorescence staining. Pictures from one out of four independent experiments are shown. Scale bar, 20 μm. d Scheme displaying the LacI-CFP-FOXO1 constructs used for the recruitment assay shown in c. e Quantification of the p300 recruitment assay. Presence or absence of p300 signal was determined for each CFP dot and counted (n = 4 independent experiments, plotted as means ± SD, one-way Anova, Tukey’s multiple comparisons test). f Heatmap of p300, P3F, H3K27ac ChIP-seq and ATAC-seq signal. g RNA-seq analysis of RH4 cells after double knockout of p300 and CBP. Total RNA was isolated from p300/CBP double knockout and empty vector control cells three days after sgRNA transduction (n = 3 independent experiments for each knockout). PCA plot performed with normalized and log-transformed count data is shown. h Gene set enrichment plot for RNA-seq after knockout of p300 and CBP, resulting in selective downregulation of P3F target genes. Source data are provided as a Source Data file.

