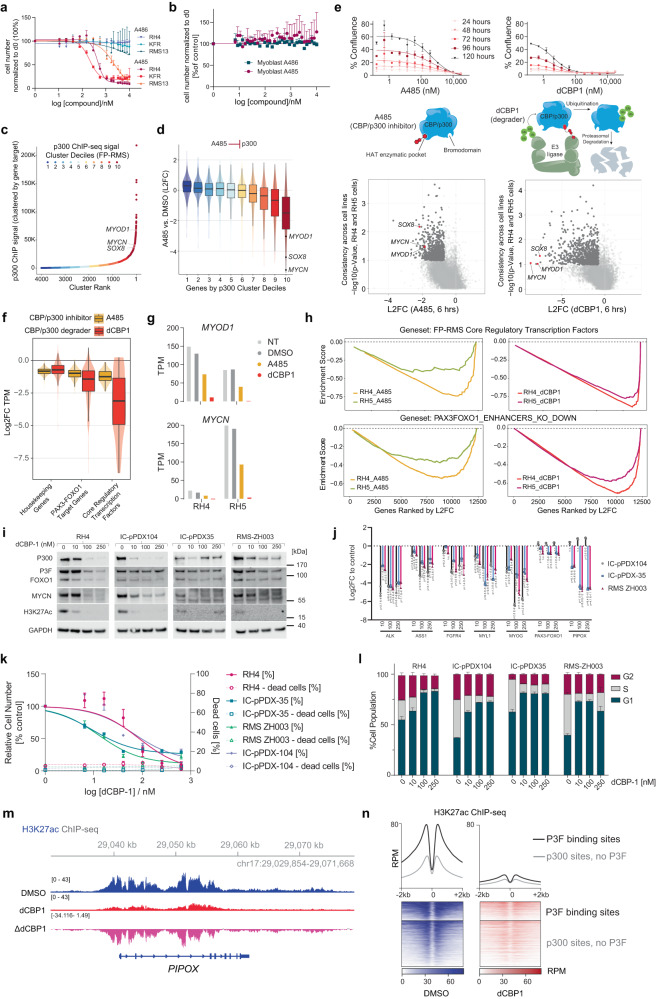
Fig. 5. CBP/p300 are required for RMS growth and the activation of P3F target genes.
a, b Relative cell number after treatment of cells with A485 and A486 for 6 days, as determined by high content microscopy (n = 3 independent experiments, means ± SD). c ChIP-seq clusters of p300 in enhancers in RH4 cells. d L2FC of mRNA in RH4 cells treated with 10 μM A485 for 6 h. Genes are ranked according to p300 cluster decile (n = 1 independent experiment, box plots of median and quartiles, whiskers showing 1.5 × inter-quartile ranges). e Upper panels, dose-response curves of RH5 cells treated with A485 and dCBP1 over 5 days as determined by Incucyte microscopy (n = 2 independent experiments, means ± SD). Middle panels, schemes depicting the mechanism of action for both drugs. Lower panels, plots comparing RNA-seq data from cells treated with A485 and dCBP1 for 6 h (n = 1 independent experiment, Welch’s t-test). f Degree of downregulation of indicated gene classes after CBP/p300 inhibition (n = 1 independent experiment; box plots of median and quartiles, whiskers showing 1.5 × inter-quartile ranges). g TPM values of MYOD1 and MYCN after drug treatment in RH4 and RH5 (MYCN-amplified) cells. h GSEA comparing the degree of downregulation of core regulatory transcription factor genes and genes within P3F enhancer TADs upon P3F silencing via shRNA. i Western blot detection of indicated proteins from indicated cells after dCBP1 treatment for 24 h. One representative blot from n = 3 is shown. j mRNA levels in indicated cells after 24 h of dCBP1 treatment. L2FC to DMSO is shown (n = 3 independent experiments, means ± SD, Tukey’s multiple comparisons test). k Relative cell number and percentage of dead cells in indicated cells after dCBP1 treatment for 6 days (n = 3 independent experiments, means ± SD). l Cell cycle analysis of indicated cells after dCBP1 treatment for 24 h (n = 3 independent experiments, means ± SD). m H3K27ac ChIP-seq data for the PIPOX locus in RH4 cells treated with DMSO or dCBP1. Delta track shows control subtracted from dCBP1. n H3K27ac ChIP-seq signal in RH4 cells before and after treatment with dCBP1 for 6 h. Source data are provided as a Source Data file.

