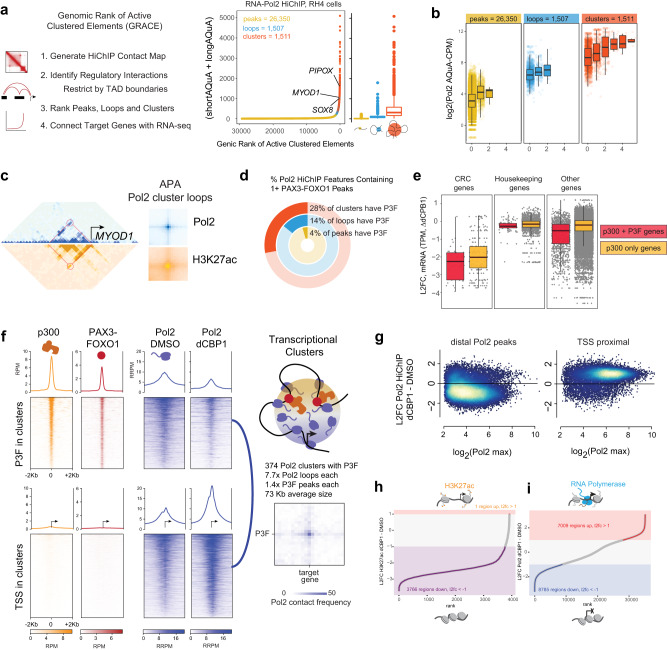
Fig. 6. p300 is required for Pol2 clusters connecting P3F to its targets.
a Number of Pol2 HiChIP contacts (short and long AQuA-normalized contacts, counts-per-million (CPM)) in RH4 cells plotted for all HiChIP features ranked along the X-axis by increasing HiChIP signal using the GRACE algorithm. HiChIP features are categorized by number of HiChIP contacts, with peaks, loops, and clusters having 0, 1, and 1+ loops, respectively. Box plots of median and quartiles, whiskers showing 1.5 × inter-quartile ranges. b 3D connectivity as function of overlapping P3F peaks for Pol2 peaks, loops, and clusters. c Left, HiChIP contact maps (5 kb bins) for Pol2 (blue) and H3K27ac (gold) in RH4 cells at the MYOD1 locus (red circle, example cluster loop). Right, Aggregate Peak Analysis (APA) plots of all Pol2 loops from clusters. Box plots of median and quartiles, whiskers showing 1.5 × inter-quartile ranges. d Percentages of Pol2 HiChIP features containing 1 or more P3F peaks (from independent ChIP-seq experiment). e Pol2 HiChIP features plotted by the L2FC in expression of indicated gene classes associated with the contacts in RH4 cells following 6 h dCBP1 treatment. Each group is split between features which associate TSS to p300 sites with or without P3F. (n = 1 independent experiment; box plots of median and quartiles, whiskers showing 1.5 × inter-quartile ranges). f ChIP-seq signal in RH4 cells for p300 and P3F, and HiChIP for Pol2 before and after 6 h dCPB1 treatment for all Pol2 cluster anchor constituents that contain P3F ChIP-seq peaks (top panels), and at the TSS for genes contained in Pol2 HiChIP clusters (bottom panels); scheme of Pol2 HiChIP cluster containing p300, P3F, and Pol2 (top right). Pol2 HiChIP APA plot showing the 3D connectivity of one distal P3F-bound enhancer and its putative target TSS (bottom right). Blue line, positions in the left-adjacent 2D heatmaps. g M-A scatter plots for L2FC of Pol2 HiChIP density at Pol2 peaks distal and proximal to TSS after 6 h dCBP1 treatment of RH4 cells. h,i Rank plots of RH5 H3K27ac HiChIP (h) and RH4 Pol2 HiChIP (i) regions based on L2FC of AQuA RRPM between DMSO and dCBP1 treatments. Schematics show active (top) and inactive (bottom) chromatin.

