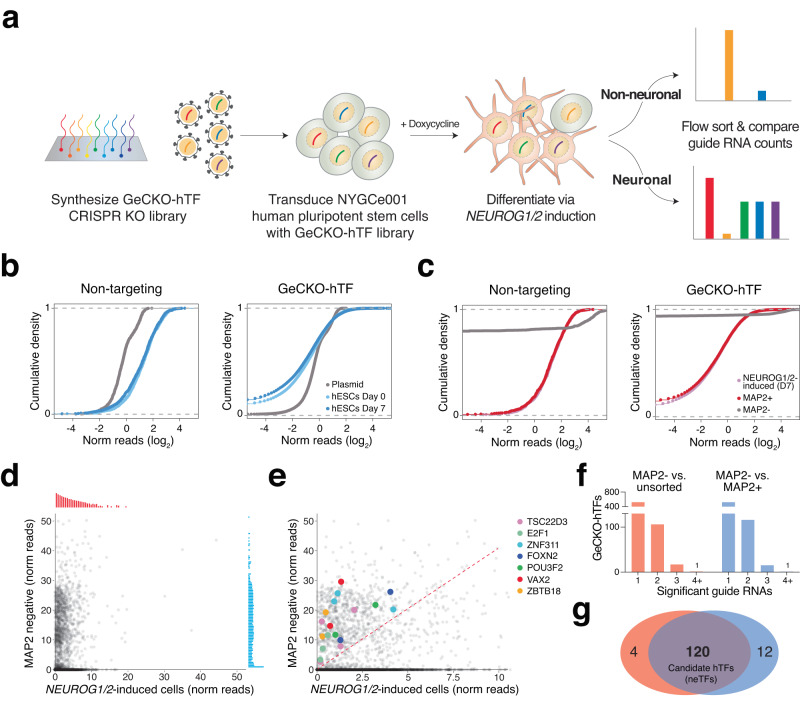
Fig. 2. A TFome-scale CRISPR screen in pluripotent cells to identify required TFs for NEUROG1/2-induced neuronal differentiation.
a Schematic of CRISPR screen targeting 1891 hTFs with 10 guide RNAs each. b Guide RNA representation for the cloned library and post-transduction library in human embryonic stem cells. Distributions for both non-targeting (negative) control guide RNAs (left) and TF-targeting guide RNAs (right) are shown. c Guide RNA representation for the NEUROG1/2-induced cells and MAP2-tdTomato sorted populations. Distributions for both non-targeting (negative) control guide RNAs (left) and TF-targeting guide RNAs (right) are shown. d, e Enrichment of guide RNAs in MAP2-negative cells versus all NEUROG1/2-induced cells (unsorted). Panel e shows an enlargement of enriched guide RNAs from panel d. Select TFs with multiple enriched guide RNAs are indicated with colored dots. Red dashed line indicates enrichment of the top 10% of non-targeting guide RNAs. f Number of TFs with enriched guide RNAs in the MAP2-negative population compared to either the unsorted population or the MAP2-positive population. g Overlap of TFs with multiple enriched guide RNAs (2 or more) in the MAP2-negative population when compared to either the unsorted population or the MAP2-positive population.

