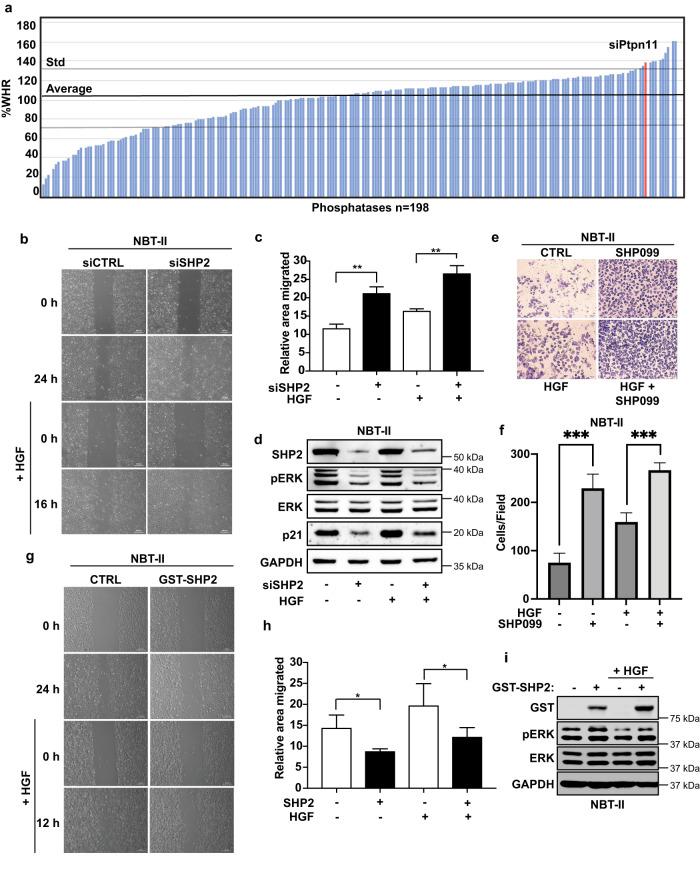
Fig. 1. SHP2 regulates cell migration.
a Bar graph displays percentage wound closure (%WHR) compared to controls obtained from siRNA phosphatase screen. b NBT-II cells transduced with siRNA targeting SHP2 or relevant controls were plated for scratch assay and treated with or without HGF (8 μM), panels show migration at 0, 16, and 24 h. Representative images are shown (scale bars, 200 μm). c Percentage of migrated area was determined with respect to control (0 h) and a graph was plotted. **P < 0.01 using Student’s t-test. Data are mean ± S.D. from three random fields. Data are representative of three independent experiments with similar results. d Immunoblot of NBT-II cells from b and c. Lysates were probed with indicated antibodies. e Transwell assay of NBT-II cells treated with SHP099 (5 μM), HGF (8 μM), or in combination for 48 h prior to fixation and crystal violet staining (scale bars 50 μm). f Graph represents average number of migrated cells taken from 4 different random fields from (e). Data are mean ± S.D. of triplicate samples from a representative experiment performed three times. ***P < 0.001 using Student’s t-test. g NBT-II cells ectopically expressing GST tagged SHP2 or relevant controls were plated for scratch assay and treated with or without HGF (8 μM), panels show migration at 0, 12, and 24 h. Representative images are shown (scale bars, 200 μm). h Percentage of migrated area was determined with respect to control (0 h) and a graph was plotted. *P < 0.05 using Student’s t-test. Data are mean ± S.D. from three random fields. Data are representative of three independent experiments with similar results. i Immunoblot of NBT-II cells expressing GST-SHP2. Lysates are probed with indicated antibodies.

