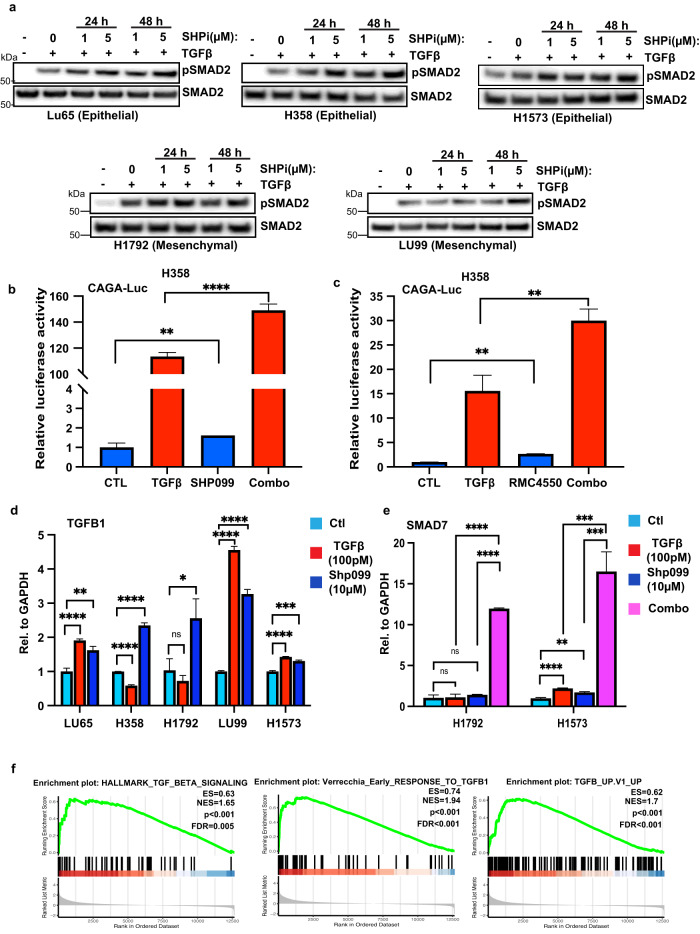
Fig. 3. SHP2 inhibition enhances TGFβ activity in KRAS mutant lung cancer.
a KRAS mutant lung cancer cell lines LU65, H358, H1573, H1792, and LU99 were treated with either TGFβ (100 pM) or SHP099 (1 or 5 μM) or both for 24 or 48 h. Lysates were probed with indicated antibodies. b TGFβ responsive luciferase (CAGA luciferase) of H358 cells stimulated overnight with TGFβ (100 pM) or SHP099 (5 μM) or in combination. Lysates were collected and luciferase measured by a luminometer. Error bars represent S.D. of triplicates. Experiments are representative of three independent experiments. **P < 0.01, ****P < 0.0001 as determined by Student’s t-test. c TGFβ responsive luciferase (CAGA luciferase) of H358 cells stimulated overnight with TGFβ (100 pM) or RMC-4550 (5 μM) or in combination. Lysates were collected and luciferase measured by a luminometer. Error bars represent S.D. of triplicates. Experiments are representative of three independent experiments. **P < 0.01 as determined by Student’s t-test. d LU65, H358, H1792, LU99 or H1573 cells were stimulated with TGFβ (100 pM) or SHP099 (10 μM) as indicated for 3 h. TGFB1 mRNA levels relative to GAPDH are shown as evaluated by quantitative real time PCR. Data are shown as the mean ± S.D. of triplicate samples from a representative experiment performed two times. *P < 0.05,**P < 0.01, ***P < 0.001, ****P < 0.0001 as determined by Student’s t-test. e H1792, or H1573 cells were stimulated with TGFβ (100 pM) or SHP099 (10 μM) or in combination as indicated for 3 h. SMAD7 mRNA levels relative to GAPDH are shown as evaluated by quantitative real time PCR. Data are shown as the mean ± S.D. of triplicate samples from a representative experiment performed two times. **P < 0.01, ***P < 0.001, ****P < 0.0001 as determined by Student’s t-test. f Gene set enrichment analysis of TGFβ (HALLMARK_TGF_BETA_SIGNALLING, VERRECCHIA_EARLY_RESPONSE_TO_TGFB1, TGFB_UP.V1_UP) gene set signatures, extrapolated from the GSE109270 data set derived from five vehicle- and seven SHP099-treated patient derived xenograft tumours. Enrichment scores (ESs), normalized enrichment scores (NESs), P values, and false discovery rates (FDRs) are reported.

