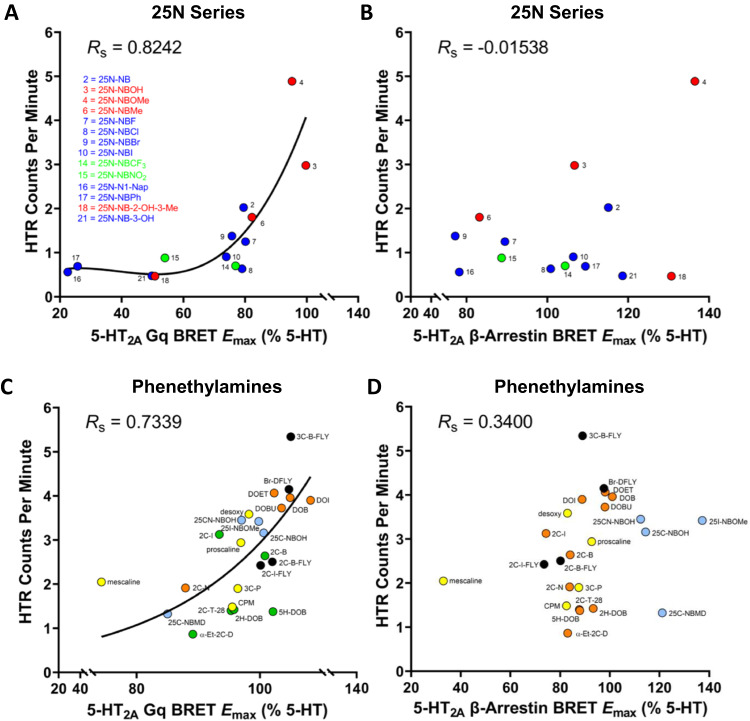
Fig. 5. Psychedelic potential is correlated with 5-HT2A-Gq signaling.
A Scatter plot showing the relationship between 5-HT2A receptor Gq-efficacy (EMAX values) and head-twitch response (HTR) magnitude (maximum counts per minute induced by the compound) for 14 members of the 25N series. Spearman’s rank correlation coefficient Rs is shown. The regression line generated by fitting the data using non-linear regression is included as a visual aid. B Scatter plot showing the relationship between 5-HT2A receptor β-arrestin2 recruitment efficacy (EMAX values) and HTR magnitude for 14 members of the 25N series. C Scatter plot showing the relationship between 5-HT2A receptor Gq-efficacy (EMAX values) and HTR magnitude for 24 phenethylamine psychedelics. To illustrate the non-linear nature of the relationship, the regression line generated by fitting the data using non-linear regression is shown. D Scatter plot showing the relationship between 5-HT2A receptor β-arrestin2 recruitment efficacy (EMAX values) and HTR magnitude for 24 phenethylamine psychedelics. Source data are provided as a Source Data file.

