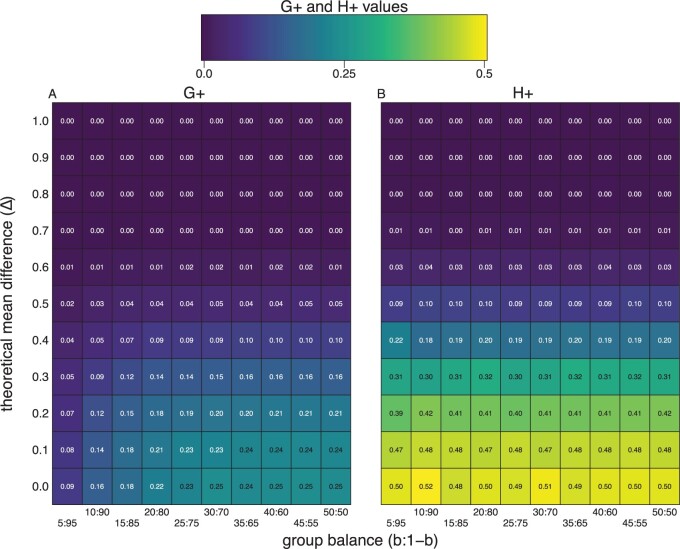
Fig. 2.
The  discordance metric does not change as a function of class balance. We randomly sampled
  = 1000 observations with 500 features from a mixture distribution
  with
with  being the probability of an observation coming from
  and
and  coming from
  with a true mean difference (
 ) (
) ( -axis). Along the
  -axis we change group (or class) balance from balanced (e.g.,
  = 0.50) and to imbalanced (e.g.,
  = 0.05) groups. The plots are heatmaps of true
  (left) and
  (right) discordance metrics, which shows
  does not change as a function of class balance (
 -axis), only as a function of the true effect size (
 -axis).

