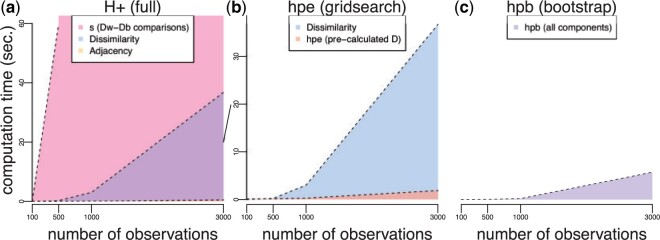
Fig. 3.
Computation times (seconds) for exact and approximate  calculations as a function of increasing number of observations
  . Computational time (
 -axis) as a function of observations (
 -axis) to calculate the individual components of (a) exact
  including (i) the dissimilarity matrix
  (purple) scaling
  , (ii) the adjacency matrix (orange), and (iii) the most expensive operation
  (pink) scaling
  . Note,
  is only shown for
  = 100 and 500 observations, but the trend is shaded in for the other observations; (b,c) have different y-axes than (a). The diagonal line between (a) and (b) connects the 20-s ticks of these two axes. (b) Approximate
  estimation (HPE) using the grid search procedure including (i) the dissimilarity matrix
  (blue) scaling
  and (ii) the HPE algorithm to estimate
  (orange) scaling
  ; (c) approximate
  estimation using the bootstrap procedure (HPB) (purple), which scales similarly to HPE without the computational expense required for calculating
  . Note (b) and (c) have a different
  -axis scale than (a) for an zoomed in visualization of time.

