Fig. 5.
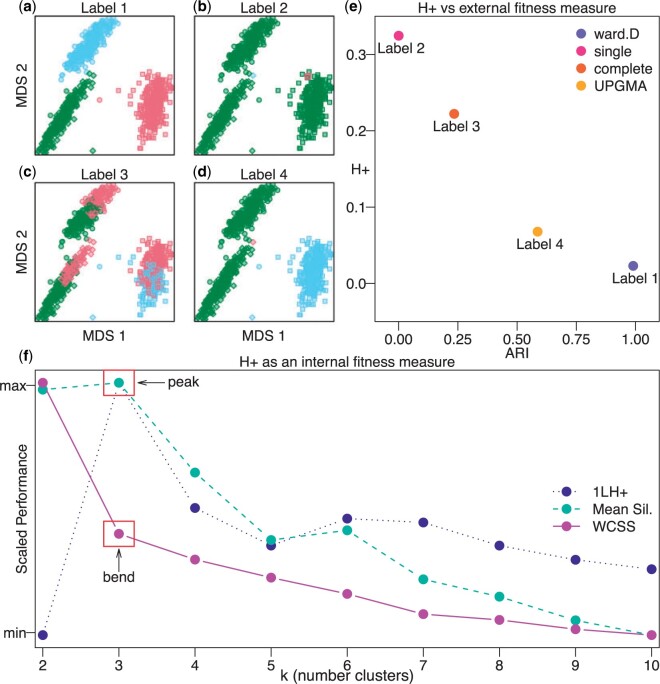
The  metric is an internal validity measure for assessing the performance of induced cluster labels. Multidimensional scaling (MDS) plots with shapes representing true cell type labels from the
  scRNA-seq data set and colors representing induced (or predicted) cluster labels from four hierarchical clustering methods implemented in the hclust() function in the base R stats package including (a) Ward’s method, (b) single linkage method, (c) complete linkage method, and (d) unweighted pair group method with arithmetic mean (UPGMA). (e) Scatter plot of
  (an internal validity metric) compared to Adjusted Rand Index (ARI) (an external validity metric) demonstrating shared information between the two metrics, which
  (calculated with the HPE algorithm 1 using
  ) recovers without the need of an externally labeled set of observations. (f) A performance plot with three internal validity metrics (
 -axis scaled between 0 and 1): (i)
  (for ease of comparison) calculated from labels induced using with
  (
( -axis), (ii) mean silhouette score, and (iii) within-clusters sums of square (WCSS). The “peak” of the
  metric at the correct
  indicates that
  accurately identifies the most accurate label in a comparable fashion to established internal fitness measure, namely a “peak” at the mean silhouette score and a “bend” in the WCSS curve.

