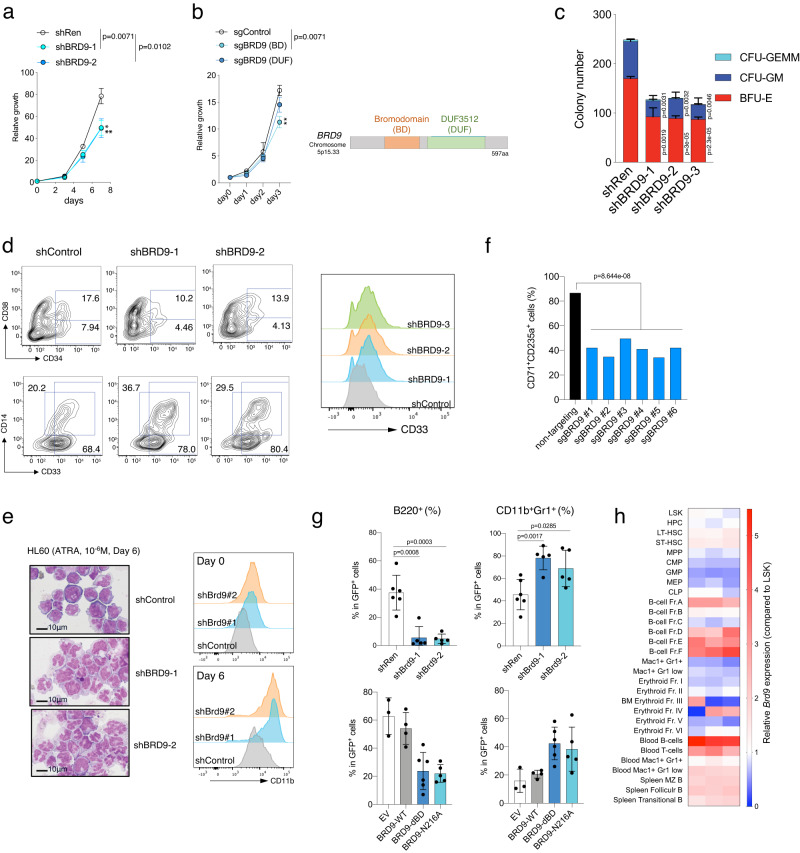
Fig. 1. BRD9 is required for normal differentiation and stemness of HSCs.
a The number of viable human CD34+ cord blood cells over the course of 7 days, beginning 3-days post-transduction of shRNAs. n = 3 independent experiments; error bars, means ± s.e.m. b The number of K562 cells with sgControl, sgBRD9 targeting bromodomain (BD) or domain of unknown function (DUF), over the course of 3 days. The domain structure of wild-type BRD9 is indicated (right). n = 3 independent experiments; error bars, means ± s.e.m. c Colony formation of human CD34+ cord blood transduced with a scramble (control) or BRD9 targeting shRNA. Cells were sorted on the basis of GFP positivity 3 days after lentiviral transduction and colonies were scored 10 days after plating in methylcellulose. n = 3 independent experiments; mean and s.e.m are plotted. d Expression of the surface markers for HSCs (CD34 and CD38) and for myeloid differentiation (CD11b and CD14), as assessed by flow cytometry 10 days after plating under the condition with the supplement for CD34 expansion and myeloid differentiation. The proportion of CD34+, CD34+CD38−, CD33+, and CD14+ are indicated. Representative histograms of CD33 staining in shControl and shBRD9 HSCs are shown on the right. e Representative cytospin images (left) and histograms of CD11b staining (right) in HL60 cells with shControl and shBRD9 after all-trans retinoic acid (ATRA) treatment (10−6M) for 6 days (n = 3 independent experiments). Bar: 10 µm. f The proportion of CD71+CD235a+ cells in K562 cells with BRD9 KO after hemin treatment for 3 days. Two sgRNAs and three independent single cell clones per sgRNA were used. g Frequency of B220+ (left) and CD11b+Gr1+ (right) cells in GFP+ donor-derived peripheral blood cells in the transplant model of normal BM cells transduced with shRen (shControl, n = 6 independent samples), shBrd9 (n = 6 independent samples), empty vector (EV, n = 3 independent samples), BRD9-WT (n = 4 independent samples), dBD (n = 6 independent samples), and N216A mutants (n = 5 independent samples). Error bars, means ± s.e.m. h Heatmap of Brd9 mRNA expression evaluated quantitative RT-PCR in each hematopoietic stem and progenitor cells (HSPCs) and mature cells. The relative expression levels against that of LSK are shown. Two-tailed Student’s t test. Source data are provided as a Source Data file.

