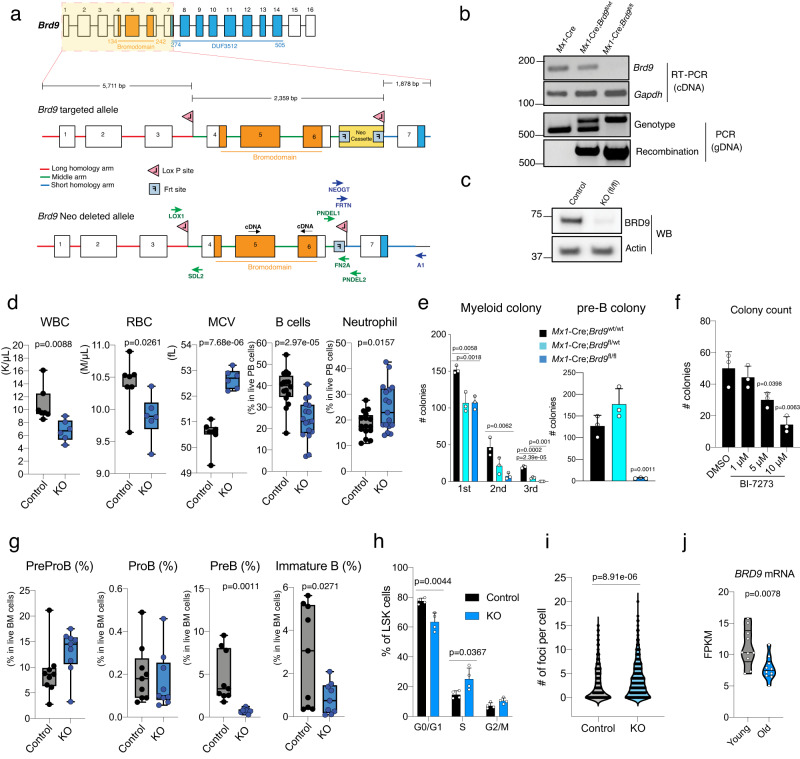
Fig. 2. Generation and characterization of Brd9 knockout murine model.
a Target scheme for Brd9 conditional knockout (cKO) mice. Brd9 targeted alle and Brd9 Neo Cassette deleted allele are indicated. Primers were designed for confirming LoxP insertion, Neo Cassette deletion, and genotyping. b Successful deletion and recombination of Brd9 in the cKO bone marrow (BM) 4 weeks post-pIpC injections. PCR by using cDNA and genomic DNA from pIpC-treated mice bone marrow cells to validate Brd9 exon 4–6 deletion (Representative images of n = 3 independent experiments). Primers PNDEL1/PNEDL2 and LOX1/PNDEL2 were used for genotype and recombination, respectively. c Western blot for murine BRD9 in whole BM cells derived from pIpCed Mx1-Cre;Brd9WT/WT (Control) mice and Mx1-Cre;Brd9fl/fl mice cKO (fl/fl) mice (Representative images of n = 3 independent experiments). d Brd9 cKO mice developed a cytopenia phenotype with macrocytosis 3 months post-pIpC. Whole blood counts of white blood cells (WBCs), red blood cells (RBCs), and mean corpuscular volume (MCV) and frequency of B cells and neutrophils in Mx1-Cre;Brd9WT/WT (Control) mice and Mx1-Cre;Brd9fl/fl mice cKO (KO) mice. n = 6 each in WBC, RBC, and MCV; n = 16 (Control) and n = 17 (KO) in B cells and Neutrophils, both males and females. For box and whiskers plots throughout, bar indicates median, box edges first and third quartile values, and whisker edges minimum and maximum values. p value relative to control by a two-sided t-test. e Colony formation of whole BM cells. Colonies were scored 10 days after plating in methylcellulose in M3434 and M3630, for myeloid colonies and pre-B colonies, respectively. n = 3 independent experiments; mean and s.e.m are plotted. Statistical significance was calculated with two-tailed unpaired t-test. f Colony formation of wildtype whole BM cells treated with DMSO and BI-7273 (BRD9 bromodomain inhibitor) for 24 h, respectively. Colonies were scored 10 days after plating in methylcellulose M3630 for Pre-B colonies. n = 3 independent experiments; mean and s.e.m are plotted. p value relative to control by a two-sided t-test. g Frequency of PreProB, ProB, PreB, and Immature B cells in BM of 24-week-old Mx1-Cre;Brd9WT/WT (Control) mice and Mx1-Cre;Brd9fl/fl mice cKO (KO) mice. n = 9 each, both males and females. For box and whiskers plots, bar indicates median, box edges first and third quartile values, and whisker edges minimum and maximum values. p value relative to control by a two-sided t-test. h Percentages of bromodeoxyuridine (BrdU)+ (S), DAPI+BrdU− (G2/M), DAPI-BrdU- (G0/G1) LSK cells in the BM of primary 12-week-old Brd9 KO and control mice. n = 4 independent experiments, males; mean and s.e.m are plotted. p value relative to control by a two-sided t-test. i The number of foci in gH2AX (a marker of DNA damage)-staining of Brd9 KO and control Lin−Kit+ cells. p values were calculated relative to the control group by two-sided t-tests and are indicated in the figures. j BRD9 mRNA levels in young and old human Lin−CD34+CD38− cells (n = 10 per age group). p value relative to control by a two-sided t-test. Source data are provided as a Source Data file.

